
Chapitre 66. Grapher les informations de performance avec MRTG. Installation monitoring mrtg snmp debian. Sommaire : => Installation de base SNMP et MRTG=> Ajouter un graphique de contrôle du ping => Ajouter un graphique de contrôle de la mémoire CACHE=> Ajouter un graphique de contrôle de la mémoire RAM => Ajouter un graphique de surveillance CPU (1ère méthode) => Ajouter un graphique de surveillance CPU (2ème méthode)=> Ajouter un graphique de surveillance de Hits Apache2 => Ajouter un graphique de surveillance de Traffic Apache2 => Ajouter un graphique de contrôle des requêtes MySQL=> Ajouter un graphique de contrôle de traffic réseau Installation de base SNMP et MRTG : Installer snmpd : # apt-get install snmpd Editer le fichier de configuration du serveur snmp afin de le rendre utilisable par MRTG : # nano /etc/snmp/snmpd.conf ### commenter cette ligne ### # com2sec paranoid default public ### décommenter cette ligne ### com2sec readonly default public Redémarrer snmpd :
Shell Script: Reporting Suite. Voilà un petit script vous permettant d'obtenir tous les jours les informations concernant votre système par email.
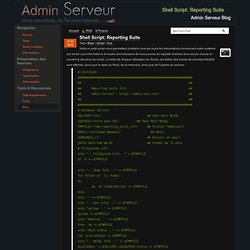
Les informations envoyés sont basiques et vous pouvez en rajouter d'autres sans aucun soucis en suivant la structure du script. La taille de chaque utilisateur du /home, les tailles des bases de données MySQL sont affichés, ainsi que le statu du Raid, de la mémoire, ainsi que de l'uptime du serveur. #! Il ne vous reste plus qu'à mettre ce script par cron pour recevoir tous les jours, ou toutes les semaines les informations concernant ce script. crontab -e # Ajout pour une exécution tous les jours à 6h03 3 6 * * * /home/scripts/reporting.sh.
Munin - Browse /old stable/Obsolete. RRD Statistics 1.0 - Coyote Linux & BrazilFW Add-ons. RRDStats is a coyote linux package for network traffic and link quality monitoring.
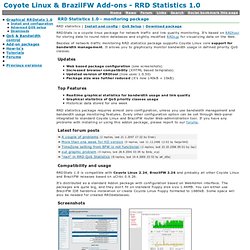
It's based on RRDtool for storing data to round robin databases and slightly modified RRDcgi for visualizing data on the Web. Besides of network traffic monitoring RRD statistics package supports Coyote Linux core support for bandwidth management. It allows you to graphically monitor bandwidth usage in defined priority QoS classes.
Updates Web based package configuration (see screenshots) Increased browser compatibility (XHTML based templates) Updated version of RRDtool (now uses 1.0.50) Package size was further reduced (it's now 140kB + 10kB) Top Features Realtime graphical statistics for bandwidth usage and link quality Graphical statistics of QoS priority classes usage Historical data stored for one week RRD statistics package requires almost zero configuration, unless you use bandwidth management and bandwidth usage monitoring features. Latest forum posts Compatibility and usage Screenshots Demo. Network Traffic Monitoring with RRDTool. Network Traffic Monitoring with RRDTool This page details the use of RRDTool for monitoring the network traffic through one or more network interfaces.
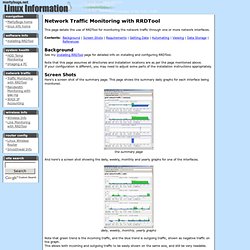
Background See my Installing RRDTool page for detailed info on installing and configuring RRDTool. Note that this page assumes all directories and installation locations are as per the page mentioned above. If your configuration is different, you may need to adjust some parts of the installation instructions appropriately. Screen Shots Here's a screen shot of the summary page. The summary page And here's a screen shot showing the daily, weekly, monthly and yearly graphs for one of the interfaces. daily, weekly, monthly, yearly graphs Note that green trend is the incoming traffic, and the blue trend is outgoing traffic, shown as negative traffic on the graph. Requirements You'll need: Getting Data The first task is to determine how to obtain the data we want to insert into the RRD database.
GNU/Opensource. Nagios - The Industry Standard in IT Infrastructure Monitoring. PRTG Network Monitor - intuitive network monitoring software. Monitor everything!

Thanks to PRTG you can monitor everything in your infrastructure including LANs, WANs, servers, websites, applications and much more. Network autodiscovery PRTG can scan network segments by pinging defined IP ranges. This way PRTG will automatically recognize a wide range of devices and systems and create sensors from predefined device templates. This saves you a lot of configuration work and you can start monitoring right away.
Maps With PRTG Maps you can create web pages with up-to-date monitoring data in your desired design. Alerts PRTG alerts you when it discovers warnings or unusual metrics. „I particularly like having breakfast at home and just surveying my domain, and understanding what's working and what isn't Steve Coppin, Oxford University – More successful customer stories >> Fair licensing. TRIAL – Unlimited sensors for 30 days, after that 100 sensors (up to 10 devices or more) free forever One-time payment incl. 12 month maintenance (excl. tax) 1. 2. 3. MRTG - Tobi Oetiker's MRTG - The Multi Router Traffic Grapher. What it does You have a router, you want to know what it does all day long?
Then MRTG is for you. It will monitor SNMP network devices and draw pretty pictures showing how much traffic has passed through each interface. Routers are only the beginning. MRTG is being used to graph all sorts of network devices as well as everything else from weather data to vending machines. MRTG is written in perl and works on Unix/Linux as well as Windows and even Netware systems. News Steve Shipway has written a book on MRTG. Download MRTG is free software. If you run into trouble, check out support options.
Sponsorship and Appreciation.