
JTE v9n1 - Choosing Qualitative Research: A Primer for Technology Education Researchers. A number of writers have commented on the dearth of substantive research within the field of technology education, and point to the expansion of its research agenda as a means of strengthening the discipline.
Waetjen, in his call for good research in technology education, states that "the plea is to use experimental type research as much as possible" (1992, p. 30). Interestingly, the three areas of research need outlined in his essay would all lend themselves to alternative methodologies, including qualitative methodologies. More recently, others have called for an expansion in the types of research methods used. Of the 220 reports included in Zuga's review of technology education-related research (1994), only 16 are identified as having used qualitative methods, and Zuga notes that many of those studies were conducted outside the United States.
This sentiment echoes that of an earlier writer. 1. Theoretical sensitivity refers to a personal quality of the researcher. 1. Figure 1. Qualitative Research Methods: A Data Collector's Field Guide. Introduction to Qualitative Research-Merriam 2002. Setup, Procedure & Interpretation. Introduction The Mann-Whitney U test is used to compare differences between two independent groups when the dependent variable is either ordinal or continuous, but not normally distributed.
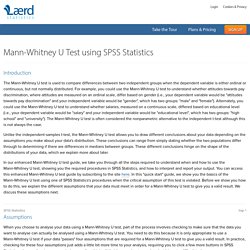
For example, you could use the Mann-Whitney U test to understand whether attitudes towards pay discrimination, where attitudes are measured on an ordinal scale, differ based on gender (i.e., your dependent variable would be "attitudes towards pay discrimination" and your independent variable would be "gender", which has two groups: "male" and "female"). Alternately, you could use the Mann-Whitney U test to understand whether salaries, measured on a continuous scale, differed based on educational level (i.e., your dependent variable would be "salary" and your independent variable would be "educational level", which has two groups: "high school" and "university").
Intro. to Statistics for the Social Sciences - On Non-Parametric Statistics. Chi-Square analysis on SPSS. SPSS Tutorial Correlation and Regression. Linear regression and correlation. Regression with SPSS: Chapter 1 - Simple and Multiple Regression. Let's focus on the three predictors, whether they are statistically significant and, if so, the direction of the relationship.
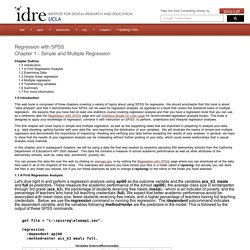
The average class size (acs_k3, b=-2.682) is not significant (p=0.055), but only just so, and the coefficient is negative which would indicate that larger class sizes is related to lower academic performance -- which is what we would expect. Next, the effect of meals (b=-3.702, p=.000) is significant and its coefficient is negative indicating that the greater the proportion students receiving free meals, the lower the academic performance. Please note that we are not saying that free meals are causing lower academic performance.
The meals variable is highly related to income level and functions more as a proxy for poverty. Thus, higher levels of poverty are associated with lower academic performance. Should we take these results and write them up for publication? We will not go into all of the details about these variables. Frequencies /var acs_k3. Tolerance. How to Use SPSS-Factorial ANOVA. One-way ANOVA with repeated measures in SPSS Statistics - Step-by-step procedure including assumptions. Introduction An ANOVA with repeated measures is used to compare three or more group means where the participants are the same in each group.
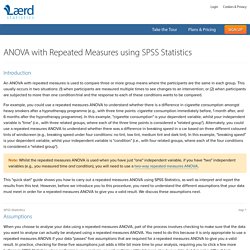
This usually occurs in two situations: (1) when participants are measured multiple times to see changes to an intervention; or (2) when participants are subjected to more than one condition/trial and the response to each of these conditions wants to be compared. For example, you could use a repeated measures ANOVA to understand whether there is a difference in cigarette consumption amongst heavy smokers after a hypnotherapy programme (e.g., with three time points: cigarette consumption immediately before, 1 month after, and 6 months after the hypnotherapy programme). One-Way ANOVA using SPSS. T-Tests Using SPSS. Type I and Type II Errors. Ethical Principles of Psychologists and Code of Conduct. Writing a research article: advice to beginners. Once the research question is clearly defined, writing the paper becomes considerably easier.

SPSS Explore Procedure. APA Formatting and Style Guide. Summary: APA (American Psychological Association) style is most commonly used to cite sources within the social sciences.
This resource, revised according to the 6th edition, second printing of the APA manual, offers examples for the general format of APA research papers, in-text citations, endnotes/footnotes, and the reference page. APA Formatting and Style Guide. Summary:
APA Formatting and Style Guide. Summary: APA (American Psychological Association) style is most commonly used to cite sources within the social sciences.
This resource, revised according to the 6th edition, second printing of the APA manual, offers examples for the general format of APA research papers, in-text citations, endnotes/footnotes, and the reference page. For more information, please consult the Publication Manual of the American Psychological Association, (6th ed., 2nd printing). Contributors:Joshua M. Resources for Students.