
Artificial Intelligence. Project management / automation. OutWiker - the tree notes organizer. Description OutWiker is designed to store notes in a tree.
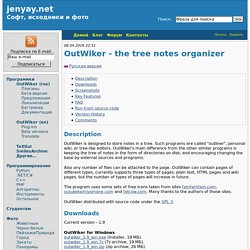
Such programs are called "outliner", personal wiki, or tree-like editors. OutWiker's main difference from the other similar programs is keeping the tree of notes in the form of directories on disk, and encouraging changing the base by external sources and programs. Also any number of files can be attached to the page. OutWiker can contain pages of different types, currently supports three types of pages: plain text, HTML pages and wiki pages, but the number of types of pages will increase in future. Data Visualization. Here Is Another Great Drive Tool for Math Teachers.
10 free tools for creating infographics. Done right, infographics can be a great way to make sense of complex data.
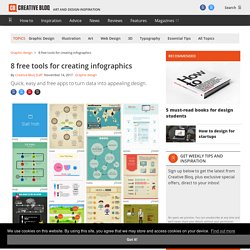
The best infographics transform complex information and data into graphics that are both easy to grasp and visually appealing. The only problem is, infographics that look like they were simple to make are often anything but. Exclusive offer: Save 15% on Adobe Creative Cloud now Here, we've selected our top free tools and apps for making infographics. The Pattern Library. Assets. WEBSITE TOOLS. Data Journalisme. 10 Awesome Brackets Extensions You Really Need. Brackets.io released version 1.2 recently, with some great new features which you can read about on their blog.
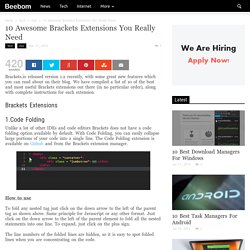
We have compiled a list of 10 of the best and most useful Brackets extensions out there (in no particular order), along with complete instructions for each extension. Brackets Extensions 1.Code Folding Unlike a lot of other IDEs and code editors Brackets does not have a code folding option available by default. With Code Folding, you can easily collapse large portions of your code into a single line.
How to use To fold any nested tag just click on the down arrow to the left of the parent tag as shown above. The line numbers of the folded lines are hidden, so it is easy to spot folded lines when you are concentrating on the code. Web tools. Visual Data. Typography tips for a more comfortable read. There are 3 small changes you can make to your content to provide a more pleasurable read.

The tips don’t just apply to design—use them to make your text documents look great, too. The names of each principle may be complicated, but understanding and using them is simple. For demonstration purposes, I’m going to use an un-styled page from A Clockwork Orange by Anthony Burgess. Important note: every font is different, so if the content doesn’t feel right, go ahead and adjust your measurements.
What’s important here is that the reader is getting a comfortable reading experience and that it looks correct to your eye. Use typographic hierarchy to give a clear sense of the structure of a page Typographic hierarchy is the visual hierarchy of the text on a page. Essential Excel Add-In Help. Excel VBA Developer Tools. NodeXL: Network Overview, Discovery and Exploration for Excel - Home. NodeXL: Network Overview, Discovery and Exploration for Excel - Home.
Simple Decision Tree. Business Functions Library for Excel. Daniel's XL Toolbox - Data analysis and visualization. Outils collaboratifs. Infographics. Timeline JS - Beautifully crafted timelines that are easy, and intuitive to use. Datawrapper. Flow Chart Maker & Online Diagram Software. Mind Map and Concept Map Creating Tools & Tips. Weave (Web-based Analysis and Visualization Environment) Search Tools. DeepDyve. 13 Google Search Tricks That Make Life A Whole Lot Easier. You think you know how to Google?
You don’t know how to Google. Even the most seasoned Googler might not know every tip and trick available with just a few extra keystrokes in the search bar. Consider this your instructions manual for the world’s most popular search engine. The Scenario: You’re playing Scrabble and some dumb-dumb says, “Hey, ‘panacea’ isn’t a word!” The Solution: Just type “define:” followed by the word you want and Google will take you straight to the definition. The Scenario: You want to find out the origin of a quote, but Google keeps giving results that are nowhere close. The Solution: Put your search phrase inside quotation marks. The Scenario: You want bread recipes that don’t list “yeast” as an ingredient. The Solution: After you enter your desired search terms, add a minus sign (-) followed by the words you want excluded. The Scenario: You want to research digital cameras that fall within a certain price range.
VisualEyes. Online Charts Builder. Hohli Online Charts Builder Load From Image URL: Chart Data can't equal to original, but very similar to it.
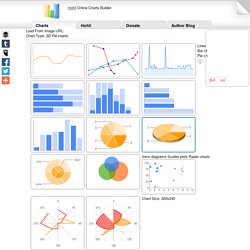
Only for images on chart.apis.google.com Chart Type: 3D Pie charts Lines. Silk - Organize your knowledge with overviews and visualizations. Weave (Web-based Analysis and Visualization Environment) News Media Sources. Create and share visual ideas online. Piktochart: Infographic and Presentation Tool for Non-Designers.
Many Eyes. DataHero: Unmask the Answers in Your Data. ChartsBin.com - Visualize your data. Perspective. ChartsBin.com - Visualize your data. Explore, create, share. Weave (Web-based Analysis and Visualization Environment) Datawrapper. Online Charts Builder. Hohli Online Charts Builder New version: Try new version of Charts Builder, it based on new Google Charts API.

Datawrapper. Plot.ly.