
D - Binomial Probability Formula. D - Box and Whisker Plots. D - Box and Whisker Plots Explained. D - Collecting and Analyzing Data. What do we mean by collecting data?
What do we mean by analyzing data? Why should you collect and analyze data for your evaluation? When and by whom should data be collected and analyzed? How do you collect and analyze data? In previous sections of this chapter, we’ve discussed studying the issue, deciding on a research design, and creating an observational system for gathering information for your evaluation. What do we mean by collecting data? Essentially, collecting data means putting your design for collecting information into operation. Recording and organizing data may take different forms, depending on the kind of information you’re collecting. Some of the things you might do with the information you collect include: There are two kinds of variables in research. What do we mean by analyzing data?
Analyzing information involves examining it in ways that reveal the relationships, patterns, trends, etc. that can be found within it. D - Creating a Circle Graph. D - Distribution. Stem and Leaf Displays Author(s) David M.
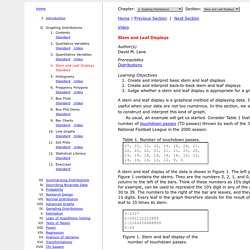
Lane Prerequisites Distributions Learning Objectives. D - How Do You Find the Probability of the Complement of an Event? D - Inclusive and Exclusive Range. D - Ipsos. D - Introduction to residuals and least squares regression. D - Least Squares Regression. Line of Best Fit Imagine you have some points, and want to have a line that best fits them like this: We can place the line "by eye": try to have the line as close as possible to all points, and a similar number of points above and below the line.
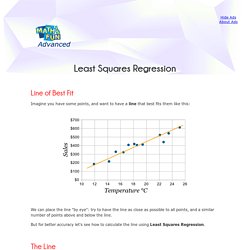
But for better accuracy let's see how to calculate the line using Least Squares Regression. D - Likert Scale. By Saul McLeod published 2008 Various kinds of rating scales have been developed to measure attitudes directly (i.e. the person knows their attitude is being studied).
The most widely used is the Likert Scale. Likert (1932) developed the principle of measuring attitudes by asking people to respond to a series of statements about a topic, in terms of the extent to which they agree with them, and so tapping into the cognitive and affective components of attitudes. Likert-type or frequency scales use fixed choice response formats and are designed to measure attitudes or opinions (Bowling, 1997; Burns, & Grove, 1997).
These ordinal scales measure levels of agreement/disagreement. A Likert-type scale assumes that the strength/intensity of experience is linear, i.e. on a continuum from strongly agree to strongly disagree, and makes the assumption that attitudes can be measured. D - Likert Scales and Data Analyses. By I.
Elaine Allen and Christopher A. Seaman Surveys are consistently used to measure quality. For example, surveys might be used to gauge customer perception of product quality or quality performance in service delivery. Likert scales are a common ratings format for surveys. D - Mean, Median, and Mode Crash Course. D - Mean, Mode, Median, and Standard Deviation. The is the average and is computed as the sum of all the observed outcomes from the sample divided by the total number of events.
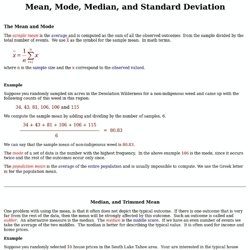
We use x as the symbol for the sample mean. In math terms, where n is the sample size and the x correspond to the observed valued . D - Methods of Sample Selection. D - Methods of Survey. D - Misleading Graphs. D - Odds Are, It's Wrong. For better or for worse, science has long been married to mathematics.
Generally it has been for the better. Especially since the days of Galileo and Newton, math has nurtured science. Rigorous mathematical methods have secured science’s fidelity to fact and conferred a timeless reliability to its findings. P VALUE A P value is the probability of an observed (or more extreme) result arising only from chance.
S. During the past century, though, a mutant form of math has deflected science’s heart from the modes of calculation that had long served so faithfully. It’s science’s dirtiest secret: The “scientific method” of testing hypotheses by statistical analysis stands on a flimsy foundation. Replicating a result helps establish its validity more securely, but the common tactic of combining numerous studies into one analysis, while sound in principle, is seldom conducted properly in practice. Statistical insignificance How could so many studies be wrong? D - Online Statistics Education. Developed by Rice University (Lead Developer), University of Houston Clear Lake, and Tufts University OnlineStatBook Project Home This work is in the public domain.
Therefore, it can be copied and reproduced without limitation. However, we would appreciate a citation where possible. Please cite as: Online Statistics Education: A Multimedia Course of Study ( Project Leader: David M. If you are an instructor using these materials, I can send you an instructor's manual, PowerPoint Slides, and additional questions that may be helpful to you. D - Outliers. D - Outliers in a Box-and-Whisker Plot. D - Plotting Likert and Other Rating Scales. D - Sample Size Calculator. This Sample Size Calculator is presented as a public service of Creative Research Systems survey software.
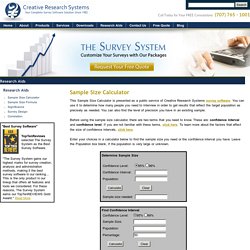
You can use it to determine how many people you need to interview in order to get results that reflect the target population as precisely as needed. You can also find the level of precision you have in an existing sample. Before using the sample size calculator, there are two terms that you need to know. These are: confidence interval and confidence level. If you are not familiar with these terms, click here. Enter your choices in a calculator below to find the sample size you need or the confidence interval you have. Sample Size Calculator Terms: Confidence Interval & Confidence Level. D - Scatter (XY) Plots. A Scatter (XY) Plot has points that show the relationship between two sets of data. In this example, each dot shows one person's weight versus their height.
(The data is plotted on the graph as "Cartesian (x,y) Coordinates") Example: The local ice cream shop keeps track of how much ice cream they sell versus the noon temperature on that day. D - Standard Deviation and Variance. Deviation just means how far from the normal Standard Deviation The Standard Deviation is a measure of how spread out numbers are.
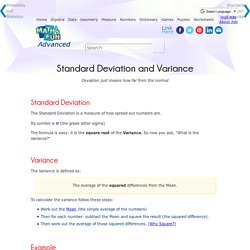
Its symbol is σ (the greek letter sigma) The formula is easy: it is the square root of the Variance. So now you ask, "What is the Variance? " Variance. D - Statistical Analysis and Research Methodology. Statistical analysis is fundamental to all experiments that use statistics as a research methodology. Most experiments in social sciences and many important experiments in natural science and engineering need statistical analysis. Statistical analysis is also a very useful tool to get approximate solutions when the actual process is highly complex or unknown in its true form. Example: The study of turbulence relies heavily on statistical analysis derived from experiments. Turbulence is highly complex and almost impossible to study at a purely theoretical level.
Scientists therefore need to rely on a statistical analysis of turbulence through experiments to confirm theories they propound. In social sciences, statistical analysis is at the heart of most experiments. D - Statistical Graphs Pros Cons. D - Statistics Canada. D - Stem and Leaf Plots. Archived Content Information identified as archived is provided for reference, research or recordkeeping purposes. It is not subject to the Government of Canada Web Standards and has not been altered or updated since it was archived. Please contact us to request a format other than those available. A stem and leaf plot, or stem plot, is a technique used to classify either discrete or continuous variables.
A stem and leaf plot is used to organize data as they are collected. D - Survey Sampling Methods. Sampling method refers to the way that observations are selected from a population to be in the sample for a sample survey. Population Parameter vs. Sample Statistic The reason for conducting a sample survey is to estimate the value of some attribute of a population. Population parameter. D - T/F Probability. D - True Random Number Service. D - Types of Data. D - Types of Data (handout) D - Use of Range. In statistics and mathematics, the range is the difference between the maximum and minimum values of a data set and serve as one of two important features of a data set.
The formula for a range is the maximum value minus the minimum value in the dataset, which provides statisticians with a better understanding of how varied the data set is. D - When to Add or Multiply Probabilities? D - When to Use Mean, Median, or Mode. When not to use the mean The mean has one main disadvantage: it is particularly susceptible to the influence of outliers. These are values that are unusual compared to the rest of the data set by being especially small or large in numerical value. StudyJams. Virtual Nerd.