
GoJS Diagrams for JavaScript and HTML, by Northwoods Software. GoJS is a JavaScript and TypeScript library for building interactive diagrams and graphs.
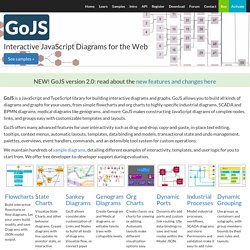
GoJS allows you to build all kinds of diagrams and graphs for your users, from simple flowcharts and org charts to highly-specific industrial diagrams, SCADA and BPMN diagrams, medical diagrams like genograms, and more. GoJS makes constructing JavaScript diagrams of complex nodes, links, and groups easy with customizable templates and layouts. The R graph Gallery – Inspiration and Help concerning R graphics. Datawrapper.
Create and design your own graphs and charts online. ChartsBin.com - Visualize your data. Gephi. Plotly. Weave (Web-based Analysis and Visualization Environment)
RAW. Chartist - Simple responsive charts. You may think that this is just yet an other charting library.
But Chartist.js is the product of a community that was disappointed about the abilities provided by other charting libraries. Of course there are hundreds of other great charting libraries but after using them there were always tweaks you would have wished for that were not included. Highly customizable responsive charts Facts about Chartist. ChartsBin.com - Visualize your data. Visualization of Relationship Data. Before uploading a data file, check the samples gallery to make sure that your data format is compatible.
Your file must be plain text. Your data values must be non-negative integers. Data must be space-separated (one or more tab or space, which will be collapsed). No two rows or columns may have the same name. Create and design your own charts and diagrams online. Gephi, an open source graph visualization and manipulation software. Information is Beautiful. Free Data Visualization Software. Datavisual. Histogram.