
PID Control with Sonoff Devices · arendst/Sonoff-Tasmota Wiki. This extension adds a PID (Proportional Integral Derivative) feature into the Sonoff-Tasmota software.
The PID algorithm is one designed to be used to control real-world processes that the users of Sonoff devices are likely to encounter. This includes room heating/cooling, temperature control when brewing, and a multitude of other processes. The PID tuning parameters are designed to be meaningful in the real world (rather than the abstract Ki Kd Kp that are often used which are completely meaningless to most). The algorithm is based on that in the node-red node node-red-contrib-pid which has been well received. In use it can either regularly be given the current process value via MQTT or if the device has a sensor attached then that sensor can be used to read the process value. The algorithm allows the relay to be used in a time proportioned way using the Time Proportioned output extension. The loop tuning parameters can be set at build time and can be adjusted at run time via MQTT. ThingBox - Scargill's Tech Blog. Update 03/01/2016 17:00: I spent (wasted) much of New Year’s Eve and New Year’s Day setting up a brand new “Jessie” installation on a Raspberry Pi 2, at the end of which I had managed to put 2 copies of Node-Red on the same machine, the sound would not come out of the 3.5” adaptor (yes, I’d messed with Raspi-Config) and the serial adaptor would not appear.
Previous installations in “Wheezy” had worked fine – but this one – using “Jessie” was determined to be a pain in the bum. (For the uninitiated, “Wheezy” and “Jessie” are code-names for versions of “Raspbian” – the operating system used on the Rasberry Pi computers). And so it was that someone in the blog pointed me to ThingBox – a package I’d looked at ages ago and which I’d previously dismissed as it was a little simple. For my purposes I needed a lot of software on the Pi (much of which subsequently proved to be un-necessary such as the full-blown MYSQL database).
I decided to look again. Well, things have moved on. Thethingbox.io. Writing custom add-ons for Node-RED - Open Source For You. If you are planning to kickstart your IoT development plans but aren’t comfortable with any particular programming environment, Node-RED could prove to be just right for you.
You can use it to start developing applications with zero or minimal programming effort, and focus more on actual computing, interfacing and communication. Node-RED is a visual wiring tool initially designed for IoT needs, but is more of a general-purpose tool these days. It can be used for interfacing sensor data, wired/wireless communication, cloud connectivity, data base connectivity, social media alerts, data analysis, system monitoring and, of course, any Node.js functionality. IBM Bluemix, SenseTecnic FRED, AT&T Flow and RedConnect.io are some of the options for getting an instance on the cloud with customised nodes and enterprise grade support. Formatting json data in Node-Red. This is what raw data recieved from the sensor looks like split paths = msg.topic.split("/"); msg.loc = paths[1]; msg.sensor = paths[3];return msg; timestamp msg.timestamp = new Date();return msg;
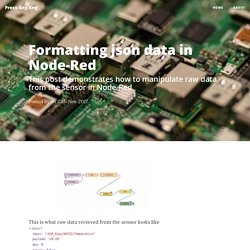
Formatting raw sensor data in Node-Red. Node-RED: Lecture 3 – Basic nodes and flows – Node RED Programming Guide. In this lecture you will get to see a few of the more commonly used nodes and build on some of the things you learnt in previous lectures.
You’ll start off with a series of examples based around the popular MQTT protocol that shows how to wire together a set of basic but very useful message processing nodes. Then you’ll briefly look at other ways to get messages into and out of your flows using protocols such as TCP, UDP and websockets. Dashboard for IoT with Node-RED. Part 2: Gauges, Graphs, Notifications, HTML. Here is the second article about creating a dashboard for object connected using the Dashboard module for Node-RED.
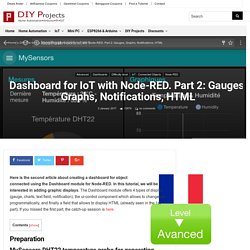
In this tutorial, we will be interested in adding graphic displays. The Dashboard module offers 4 types of display (gauge, charts, text field, notification), the ui-control component which allows to change tab programmatically, and finally a field that allows to display HTML (already seen in the 1st part).
If you missed the first part, the catch-up session is here. To illustrate the operation of the various output components of the Dashboard module, I suggest using measurements from a DHT22 MySensors temperature probe. Everything is already explained in this article. Open the Dashboard tab and add a new Tab. The Dashboard looks like this now. Node RED Programming Guide – Programming the IoT. Node-RED: Lecture 5 – The Node-RED programming model – Node RED Programming Guide.
As you’ve seen in previous lectures, Node-RED uses a visual flow-based programming paradigm[1].
This is not unique to Node-RED. Similar approaches have been used in many other domains such as music and multimedia (Max MSP), toys (Lego Mindstorms), enterprise application integration and industrial automation (LabVIEW). Like these tools, Node-RED makes it easy to switch between design and development for rapid integration, prototyping and development tasks. Tutorial: Node-RED dashboards – multiple lines on a chart – Node RED Programming Guide. Showing multiple lines on a single chart in Node-RED This simple tutorial explains how to display multiple lines on a Node-RED chart.
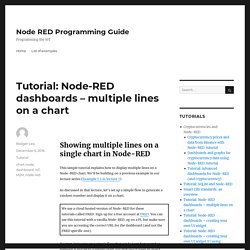
We’ll be building on a previous example in our lecture series (Example 7.2 in lecture 7) As discussed in that lecture, let’s set up a simple flow to generate a random number and display it on a chart. To start, let’s wire up a simple flow that sends a random number between 0 and 99 to a simple chart. Tutorial: A Node-RED dashboard using node-red-dashboard. This is a simple example of reading and visualizing data using the new UI nodes from node-red-dashboard.
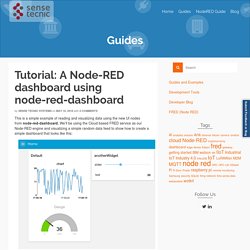
We’ll be using the Cloud based FRED service as our Node-RED engine and visualizing a simple random data feed to show how to create a simple dashboard that looks like this: NOTE: For existing FRED users – This is the new version of the UI nodes that many of you might be already using. The old version of UI nodes are still available(and it is still named as “UI nodes”, but the link to the old UI dashboard is changed to “/red/legacy_ui/“. The sample flow of this tutorial can be found in this link. Other approaches. Use Node-RED with Weather Underground API to Turn Lights On/Off at Sunrise/ Sunset. Node-RED + MQTT + ESP8266: how to drive an articulated PTZ system in WiFi. We continue our series of articles on remote control of the actuator and more particularly the PTZ (Pan-Tilt) articulated systems.
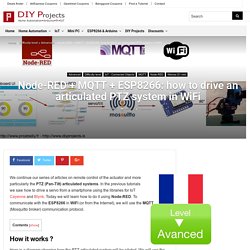
In the previous tutorials we saw how to drive a servo from a smartphone using the libraries for IoT Cayenne and Blynk. Today we will learn how to do it using Node-RED. To communicate with the ESP8266 in WiFi (or from the Internet), we will use the MQTT (Mosquitto broker) communication protocol. Here is a diagram showing how the PTZ articulated system will be piloted. Node-RED: How to integrate a connected object developed with MySensors v2 library. It is very easy to create its own connected Arduino-based objects that communicate by radio waves using the library MySensors v2 and to use them in a project Node-RED.
For this tutorial, we will use a simple probe temperature and humidity (DHT22). We will post the measures temperature and humidity using the Dashboard module. MySensors v2: decode/send messages with Node-RED. MySensors objects communicate with each other in the form of small text messages sent by radio waves. It is very easy to decode messages in following the technical specifications of the API available on the series official website of the project. The MySensors library allows to facilitate the development of applications of all kinds (mobile, robotics, home automation) without having to manage the communication between the devices layer. We use Node-RED to decode the messages received by a gateway network or series. MySensors communicates with small messages of 32 bytes (the maximum size of messages sent by a chip nRF24L01).
Header (header) of the message is 7 bytes. MySensors v2: decode/send messages with Node-RED. MySensors objects communicate with each other in the form of small text messages sent by radio waves. It is very easy to decode messages in following the technical specifications of the API available on the series official website of the project. The MySensors library allows to facilitate the development of applications of all kinds (mobile, robotics, home automation) without having to manage the communication between the devices layer.
Node-RED : Running on Raspberry Pi. The recommended way to install Node-RED on Pi is to use our script below, however Node-RED can be installed from the Recommended Software application installed on the Raspbian SD card image that can be downloaded from RaspberryPi.org. If installed in this manner it is recommended to upgrade by using the script below. Template node – Node RED Programming Guide. Node-RED’s dashboard nodes provide a comprehensive set of UI components for building basic dashboards suitable for the Internet of Things (IoT) – offering graphs, gauges, basic text as well as sliders and inputs. However, there will always be situations when you need something custom. The template node is the solution and in this tutorial we’ll show you a quick example of using it to create your own UI widget.
If you want a general introduction to the Node-RED dashboard or to UI techniques for Node-RED, then check out these resources which are part of our lecture series: The template node The ui template node is a generic node that takes valid html and Angular/Angular-Material directives and can be used to create a dynamic user interface element. In this example, we’ll create a simple dashboard element that displays some fake random data mimicking data from the UK’s power generation network. The dashboard widget using morris.js. Template node – Node RED Programming Guide. Dashboard – Node RED Programming Guide. Node-RED’s dashboard nodes provide a comprehensive set of UI components for building basic dashboards suitable for the Internet of Things (IoT) – offering graphs, gauges, basic text as well as sliders and inputs. However, there will always be situations when you need something custom.
The template node is the solution and in this tutorial we’ll show you a quick example of using it to create your own UI widget. Getting Started with Node-RED Dashboard. MQTT Node Red Android Pi Voice Control. GPIO - Easy as PI part 2 of 2, Construct your first Node-Red program. GPIO - Easy as PI... part 1 of 2 - intro to my first Node-Red program. Node-RED Raspberry Pi Camera (Take Photos) Node Red Overview and Getting Started Guide. Node Red Overview and Getting Started Guide. What is Node Red? –Node red is a Open Source flow based tool and IOT platform and Dashboard developed by IBM and written in Node.js. An Introduction to Node Red for Beginners-MQTT Subscribe. How to Node-RED! – bitluni's lab. NodeRED workshop. NodeREDeclipsecon2014. Gide2015 node red. Jamred. Raspberry pi hosting node red. Node RED Programming Guide – Programming the IoT. Getting started with Watson IoT Platform using Node-RED - developerWorks Recipes.
Introduction Node-RED is a tool for wiring together the Internet of Things in new and interesting ways, including hardware devices, APIs, and online services. It is built on top of Node.js and takes advantage of the huge node module ecosystem to provide a tool that is capable of integrating many different systems. Its lightweight nature makes it ideal to run at the edge of the network as well, such as on the Raspberry Pi, and other hack-friendly platforms.Node-RED contains the following Watson IoT nodes that helps you to connect your devices, gateways and applications to Watson IoT Platform and create IoT solutions quickly.Watson IoT Node – A pair of nodes for connecting your device or gateway to the IBM Watson Internet of Things Platform.
A device or gateway can use these nodes to send events and receive commands from the application.IBM IoT App Node – A pair of nodes for connecting your application to Watson IoT Platform. Tutorial: A Node-RED dashboard using node-red-dashboard. Node-RED tutorial. Node RED Programming Guide – Programming the IoT. Node Red MQTT on the Raspberry Pi. #128 Node-Red Tricks for Home Automation (JS, Audio, SQlite, Alexa, Mosquitto MQTT etc.)