
How to create a thematic map in Excel. How do you create a thematic map like the one above for your next presentation if you don’t have a mapping tool?
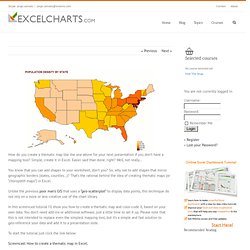
Simple, create it in Excel. Easier said than done, right? Well, not really… You know that you can add shapes to your worksheet, don’t you? So, why not to add shapes that mirror geographic borders (states, counties…)? Unlike the previous poor man’s GIS that uses a “geo-scatterplot” to display data points, this technique do not rely on a more or less creative use of the chart library. In this screencast tutorial I’ll show you how to create a thematic map and color-code it, based on your own data. To start the tutorial just click the link below: Screencast: How to create a thematic map in Excel.
Note that you need a map. Import an image to the Excel file (you can use this one, for example);Draw the shapes using the map as a reference. The other option is to obtain a file. Hope you’ll find this technique useful and feel free to suggest any improvements. 039;s Visual Basic Tips. This article teaches you a few easy ways to write better VB code.
Optimize for memory Get rid of dead code Dead code means unnecessary, inoperative code that can be removed. Dead code includes functions and sub-programs that are never called, properties that are never read or written, constants and enums that are never referenced. Dead variables are ones that are never read - even if they've been given a value. Dead code leads to excessive memory use, slower execucation, larger .exe files, higher maintenance effort and errors.
Read more about dead code removal Avoid fixed-length Strings Fixed-length strings generally occupy more memory than variable-length ones. Quick Excel Chart VBA Examples. The use of VBA in Microsoft Excel charting is a topic that would fill a large volume.
The examples here are straightforward illustrations of easy techniques to create charts, add and remove series, and move and resize charts using VBA. Outline: Quick Chart VBA Examples VBA Code to Add Chart Objects and Series Add a Chart When you record a macro to add a chart object to a worksheet, Excel comes up with the following code: Sub RecordedAddChartObject() '' RecordedAddChartObject Macro' Macro recorded 5/2/02 by Jon Peltier' Charts.Add ActiveChart.ChartType = xlXYScatterLines ActiveChart.SetSourceData Source:=Sheets("Sheet1").Range("A3:G14") ActiveChart.Location Where:=xlLocationAsObject, Name:="Sheet1" End Sub Excel uses Charts.Add followed later by ActiveChart.Location to create a chart object, and uses ActiveChart.SetSourceData to set all the series data in one shot. In my examples I use ChartObjects.Add, which also requires (or allows) me to state the position and size of the chart.
10 ways to reference Excel workbooks and sheets using VBA.