
Ivmooc.cns.iu.edu/video/02-exemplary.mp4. Information aesthetics - Data Visualization & Information Design. Two Dimensional GIS Browser. This is a special GIS (Geographic Information System) Browser that allows integration and interaction of historical maps with current geospatial data and other historical maps.
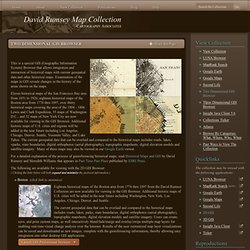
Examination of the maps in GIS reveals changes in the history of the areas shown on the maps. Eleven historical maps of the San Francisco Bay area from 1851 to 1926, eighteen historical maps of the Boston area from 1776 thru 1897, over thirty historical maps covering the area of the 1804 - 1806 Lewis and Clark Expedition, 35 maps of Washington D.C., and 32 maps of New York City are now available for viewing in the GIS Browser. Additional historic maps of U.S. cities and regions will be added in the near future including Los Angeles, Chicago, Denver, Seattle, Yosemite Valley, and Lake Tahoe.
Edward Tufte Forum. Data Visualization, Infographics, and Statistics. Special Report - International Science and Engineering Visualization Challenge. Big ideas worth pursuing. Flong - Interactive Art by Golan Levin and Collaborators. IVMOOC: Information Visualization. Sci² Tool : Documentation. Tutorials Katy Börner (2013) Sci2 Workshop at 14th International Society of Scientometrics and Informetrics Conference, Vienna, Austria.
David E. Polley and Samantha J. Hale (2013) Sci2 Workshop at Political Networks in an Interdisciplinary World, Political Networks Conference in Bloomington, IN. Katy Börner and Monika Herzig (2013) Sci2 Workshop at 4th Annual International Science of Team Science Conference, Northwestern University, Evanston, IL. Katy Börner (2012) Sci2 Tool: A Tool for Science of Science Research and Practice Tutorial, Portfolio Analysis Symposium, National Institutes of Health, Natcher Auditorium, Bethesda, MD. 2.1 Download, Install, Uninstall - Sci2 Manual - Confluence. Skip to end of metadataGo to start of metadata The Sci2 Tool is a stand-alone desktop application that installs and runs on all common operating systems.
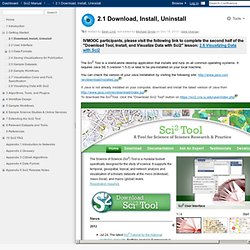
It requires Java SE 5 (version 1.5.0) or later to be pre-installed on your local machine. You can check the version of your Java installation by visiting the following site: If Java is not already installed on your computer, download and install the latest version of Java from To download the Sci2Tool, click the "Download Sci2 Tool" button on If you have not yet registered for the tool, you will need to register. Once you have registered for Sci2 you will be sent a confirmation email (it may take a few minutes). Sci2 works with all major operating systems and the download process will be the same. Save the zip file on you desktop and extract all files. Unit 1. Mapping Topic Bursts. A map of the top 50 "hot" words in the most highly cited PNAS articles from 1982-2001.
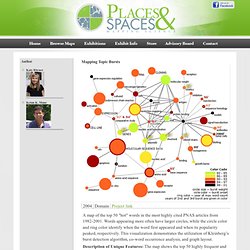
Words appearing more often have larger circles, while the circle color and ring color identify when the word first appeared and when its popularity peaked, respectively. This visualization demonstrates the utilization of Kleinberg’s burst detection algorithm, co-word occurrence analysis, and graph layout. Scientific Collaborations between World Cities. Language Communities of Twitter. 2012CartographicExhibit map Languages divide and unite.
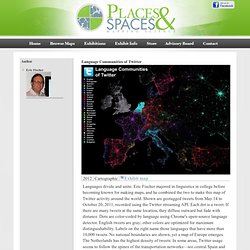
Eric Fischer majored in linguistics in college before becoming known for making maps, and he combined the two to make this map of Twitter activity around the world. The Millennium Development Goals Map. Ecological Footprint. 113 Years of Physical Review. Week 2. Data. Machine Learning Repository. Scholarly Database. DataMarket - Find, Understand and Share Data — DataMarket. Browsing data sets. Here are the most recent data sets uploaded to Many Eyes.
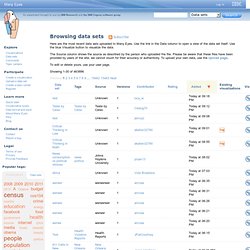
Use the link in the Data column to open a view of the data set itself. Use the blue Visualize button to visualize the data. The Source column shows the source as described by the person who uploaded the file. Please be aware that these files have been provided by users of the site; we cannot vouch for their accuracy or authenticity. To upload your own data, use the Upload page. To edit or delete yours, use your user page. Showing 1-30 of 463886 Previous123456789…1546215463Next. Top 250. HICP (2005 = 100) - monthly data (annual rate of change) — Dataset. Monthly reported number of chickenpox, New York city, 1931-1972 — Dataset. Visual Exploration of Time-Series Data. Project Description: Widespread interest in discovering features and trends in time- series has generated a need for tools that support interactive exploration.
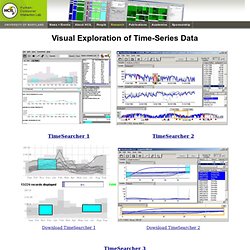
We have built a prototype environment for interactive querying and exploration of time-series data. Queries are built using timeboxes: a powerful graphical, direct-manipulation metaphor for the specification of queries over time-series datasets. These timeboxes support interactive formulation and modification of queries, thus speeding the process of exploring time-series data sets and guiding data mining. The prototype includes windows for timebox queries, individual time-series, and details-on-demand. The time-series prototype is built using HCIL's Piccolo Toolkit for Zoomable User Interfaces. Participants: Harry Hochheiser, Graduate Student Computer Science Ben Shneiderman, Professor Computer Science Papers: Availability & Download TimeSearcher can be downloaded for academic and non-commercial use. Press: Related articles: Support: Business Intelligence and Analytics.