
Process Costing and Standard Costs for ms. ForecastingSeminar.pdf (application/pdf Object) Schpdf.cfm (application/pdf Object) Provide to members personal and professional development opportunities through education, association with business professionals, and certification in management accounting and financial management skills. Top 50 Accounting Blogs. Our Top 50 Accounting Blogs reflect the blend of traditional principles, modern perspectives and revolutionary technologies that is shaping the profession and its industry today, frequently busting staid stereotypes in the process.
Find a variety of viewpoints, straightforward advice and updates on issues that affect everyone with an eye on the bottom line. If you know of a great accounting blog that should be added to our list, please contact us to let us know. Grumpy Old Accountants Associate professors Anthony Catanach, Jr. and J. Edward Ketz are the “Grumpy Old Accountants” who find plenty of fodder in today’s headlines, including big bank woes, Enron’s ongoing lessons and rogue accountants that reflect the skewing of society’s moral compass. Tick Marks Austin Peay accounting professor Dan Meyer is the author of this long running blog that comments on accounting related news and tax issues.
Treasury Cafe David K. Adrian’s Blog The younger half of the father/son team at David G. Time Series Analysis for Business Forecasting. Realization of the fact that "Time is Money" in business activities, the dynamic decision technologies presented here, have been a necessary tool for applying to a wide range of managerial decisions successfully where time and money are directly related.
In making strategic decisions under uncertainty, we all make forecasts. We may not think that we are forecasting, but our choices will be directed by our anticipation of results of our actions or inactions. Indecision and delays are the parents of failure. This site is intended to help managers and administrators do a better job of anticipating, and hence a better job of managing uncertainty, by using effective forecasting and other predictive techniques. To search the site, try Edit | Find in page [Ctrl + f]. One of the most essential elements of being a high-performing manager is the ability to lead effectively one's own life, then to model those leadership skills for employees in the organization. Why modeling? Journal of Accountancy. Trade Finance. Learning Project Introduction[edit] Welcome to Trade Finance.
The objectives of this learning project are to help you: Evaluate financial risks and methods.Select and implement most favorable methods of payment to support global activities and ensure that all related costs are included at the time of quotation.Evaluate quantity and source of finance necessary to implement global activities. Resource Sections[edit] Resource References[edit] The Beauty Of Excel #2: Formulas, Functions & Charts.
Peltier Tech Blog. Constable Henry: Just a moment, sir.
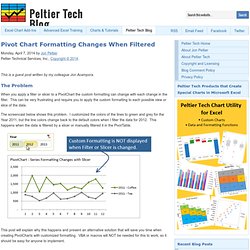
I know everyone in this neighborhood, but I’ve never seen your face before. Can you account for yourself? Freddy: Yes, I am Dr. Frederick Fronkonsteen, newly arrived from America. by The FrankensTeam This guest post is from the E90E50 FrankensTeam, i.e., Roberto Mensa, Kris Szabó, and Gábor Madács. While I was reading Jon’s work using VBA Approaches to Plotting Gaps in Excel Charts I started to think, because I felt there had to be another solution which was waiting to be discovered… Jon provided two different VBA routines as a solution for the problem: one changes the chart series formatting, the other changes the underlying data.
Some time ago I realized that it is possible to use union of ranges in chart series. Now, a few months later, thinking about the gap problem… Eureka! The union of separate ranges could be a solution, especially if we can build it up using the UDF within a named formula! Let us explain how it could work. The idea Formula solution. Dashboard Charts & Graphs: Which Is Right For Your Data? By Monique Morgan Decision-makers depend on insightful charts and graphs to help them make fast, accurate decisions.
"Insightful" charts and graphs are easy to read and understand and are the right design for your data. The wrong chart type can throw everything off and make your dashboard unusable. For example, while pie charts are most often used to display the share or percentage of a total, they're not good for comparing the relationship between two variables – a scatter chart is better for that. While bar charts are good for comparison, if you want to compare many categories of data over time, go with a line chart. Are you tasked with creating the dashboards that are used every day at your organization?
Bullet Graphs vs. Sales data for the year may be best displayed on a bullet graph. Would a bar chart work for this same data? Ever wondered why a candlestick chart works so well for stock market prices? What about a bubble chart? Spider Charts vs. Learn Microsoft Excel Online - Excel Tips, Tricks, Charting Tutorials, Download Excel Templates, Excel Formulas and More... IMA - The association of accountants and financial professionals working in business. Principles of Accounting.