
ArcGIS Alternatives and Similar Software. Quantum GIS Alternatives and Similar Software. Nearest Neighbor Analysis using QGIS. Tutorial moved to GIS is very useful is analyzing spatial relationship between features.
One such analysis is finding out which features are closest to a given feature. QGIS has a tool called ‘Distance Matrix’ which helps with such analysis. In this tutorial, we will use 2 datasets and find out which points from one layer are closest to which point from the second layer.The topics covered by this tutorial areImporting CSV file to QGIS.Understanding and using the Distance Matrix tool.Using table joins to merge the result of the analysis with the source data.Let’s get started. In this tutorial, we will walk through the process and answer this question. OCAD 11 Wiki - English. GRASS GIS: A Useful Tool for the Mountain Cartographer. GRASS GIS: A Useful Tool for the Mountain CartographerPat DunlaveyPat Dunlavey Cartographics 40 Oblong Road Williamstown, MA 01267 Tel: 413-458-9273Email: pat@pdcarto.com Presented at: International Cartographic Association (ICA)2002 Mountain Cartography WorkshopTimberline Lodge, Mt.
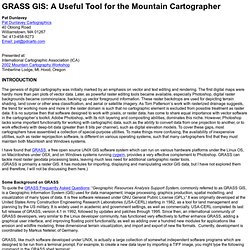
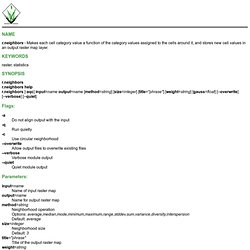
Hood, OregonINTRODUCTIONThe genesis of digital cartography was initially marked by an emphasis on vector and text editing and rendering. The first digital maps were hardly more than pen plots of vector data. Later, as powerful raster editing tools became available, especially Photoshop, digital raster backgrounds became commonplace, backing up vector foreground information. These raster backdrops are used for depicting terrain shading, land cover or other area classification, and aerial or satellite imagery. (GRASS is primarily a raster GIS. Some Background on GRASS GRASS:~ > r.in.gdal –o –e input=/home/pat/incoming/dem2.tif output=DEM2 title=dem2 Figure 1. GRASS GIS manual: r.neighbors. R.neighbors - Makes each cell category value a function of the category values assigned to the cells around it, and stores new cell values in an output raster map layer. raster, statistics r.neighborsr.neighbors helpr.neighbors [-aqc] input=name output=name [method=string] [size=integer] [title="phrase"] [weight=string] [gauss=float] [--overwrite] [--verbose] [--quiet] Flags: -a Do not align output with the input -q Run quietly -c Use circular neighborhood --overwrite Allow output files to overwrite existing files --verbose Verbose module output --quiet Quiet module output Parameters: input=name Name of input raster map.
Grass - What's the best way to produce a density map from weighted points in QGIS. I'd really like to repeat the functionality of the ArcGIS Kernel Density tool - how could I do that?
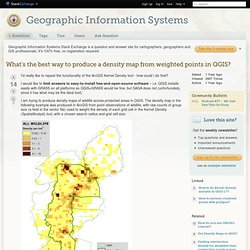
I would like to limit answers to easy-to-install free-and-open-source software – i.e. QGIS installs easily with GRASS on all platforms so QGIS+GRASS would be fine, but SAGA does not (unfortunately, since it has what may be the ideal tool). I am trying to produce density maps of wildlife across protected areas in QGIS. The density map in the following example was produced in ArcGIS from point observations of wildlife, with raw counts of group size (a field in the vector file) used to weight the density of each grid cell in the Kernel Density (SpatialAnalyst) tool, with a chosen search radius and grid cell size: In a previous question on density, it was suggested to use the GRASS v.kernel tool to mimic the ArcGIS Kernel Density tool, but v.kernel doesn't do the same job.
Suggestions on how to use v.surf.rst or any other method? Sample data. Some theory + different approaches. Your solution ought to depend on your understanding of the data and what you want to present.
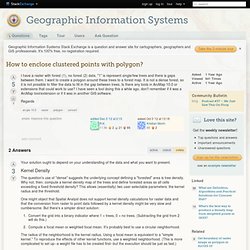
Kernel Density The question's use of "dense" suggests the underlying concept defining a "forested" area is tree density. Why not, then, compute a kernel density map of the trees and define forested areas as all cells exceeding a fixed threshold density? This allows (essentially) two user-selectable parameters: the kernel radius and the threshold. ImageJ - 9x9 Focal Mean of an Image. Imagej focal sum.