
Multivariate kernel density estimation. Kernel density estimation is a nonparametric technique for density estimation i.e., estimation of probability density functions, which is one of the fundamental questions in statistics.
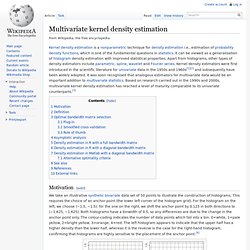
It can be viewed as a generalisation of histogram density estimation with improved statistical properties. Apart from histograms, other types of density estimators include parametric, spline, wavelet and Fourier series. Kernel density estimators were first introduced in the scientific literature for univariate data in the 1950s and 1960s[1][2] and subsequently have been widely adopted. It was soon recognised that analogous estimators for multivariate data would be an important addition to multivariate statistics. Based on research carried out in the 1990s and 2000s, multivariate kernel density estimation has reached a level of maturity comparable to its univariate counterparts.[3] Motivation[edit] Comparison of 2D histograms. Construction of 2D kernel density estimate. Definition[edit] where Plug-in[edit] . Spatial analysis. Spatial analysis or spatial statistics includes any of the formal techniques which study entities using their topological, geometric, or geographic properties.
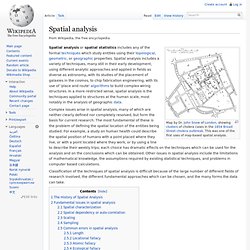
Spatial analysis includes a variety of techniques, many still in their early development, using different analytic approaches and applied in fields as diverse as astronomy, with its studies of the placement of galaxies in the cosmos, to chip fabrication engineering, with its use of 'place and route' algorithms to build complex wiring structures.
In a more restricted sense, spatial analysis is the techniques applied to structures at the human scale, most notably in the analysis of geographic data. Complex issues arise in spatial analysis, many of which are neither clearly defined nor completely resolved, but form the basis for current research. How Point Density works. The Point Density tool calculates the density of point features around each output raster cell.
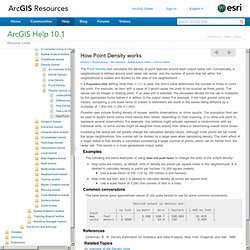
Conceptually, a neighborhood is defined around each raster cell center, and the number of points that fall within the neighborhood is totaled and divided by the area of the neighborhood. If a Population field setting other than NONE is used, the item's value determines the number of times to count the point. For example, an item with a value of 3 would cause the point to be counted as three points.
The values can be integer or floating point. If an area unit is selected, the calculated density for the cell is multiplied by the appropriate factor before it is written to the output raster. Possible uses include finding density of houses, wildlife observations, or crime reports. How Kernel Density works. The Kernel Density tool calculates the density of features in a neighborhood around those features.

It can be calculated for both point and line features. Possible uses include finding density of houses, crime reports, or roads or utility lines influencing a town or wildlife habitat. The population field could be used to weight some features more heavily than others, depending on their meaning, or to allow one point to represent several observations. For example, one address might represent a condominium with six units, or some crimes might be weighted more heavily than others in determining overall crime levels. For line features, a divided highway probably has more impact than a narrow dirt road, and a high-tension line has more impact than a standard electric pole. How should I interpret the output of density tools?
Many Spatial Analyst users are comfortable using the Density tools and are satisfied with the results they give, but sometimes there is confusion about what the output cell values mean and how they should be interpreted.

This blog will help explain how you should interpret the output from the density tools. The interpretation depends on the purpose One of the most common uses of the Kernel Density and Point Density tools is to smooth out the information represented by a collection of points in a way that is more visually pleasing and understandable; it is often easier to look at a raster with a stretched color ramp than it is to look at blobs of points, especially when the points cover up large areas of the map. Contour line. The bottom part of the diagram shows some contour lines with a straight line running through the location of the maximum value.
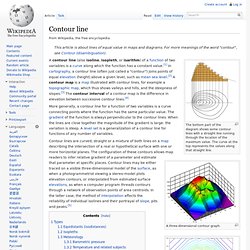
The curve at the top represents the values along that straight line. A three-dimensional contour graph.