
Mapping - Contour Education.
NT Water Resources. USAUS-H2O. NOAA: Ocean and Coasts. Ocean Acidification. This graph shows rising levels of carbon dioxide (CO2) in the atmosphere, rising CO2 levels in the ocean, and decreasing pH in the water off the coast of Hawaii.
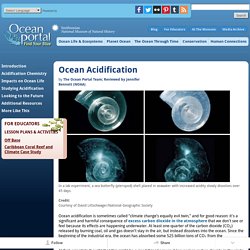
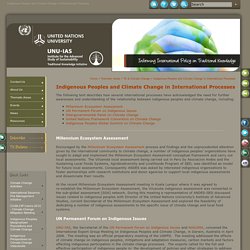
Credit: NOAA PMEL Carbon Program (Link) Carbon dioxide is naturally in the air: plants need it to grow, and animals exhale it when they breathe. But, thanks to people burning fuels, there is now more carbon dioxide in the atmosphere than anytime in the past 15 million years. Most of this CO2 collects in the atmosphere and, because it absorbs heat from the sun, creates a blanket around the planet, warming its temperature. When water (H2O) and CO2 mix, they combine to form carbonic acid (H2CO3). Seawater that has more hydrogen ions is more acidic by definition, and it also has a lower pH. Ocean Acidification Chemistry booklet.pdf. Ocean Acidification by the Alliance for Climate Education. Australia - Sea surface Temperatures. The spring of 2013 has been Australia’s warmest on record.
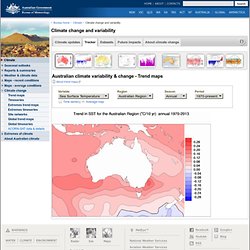
Mean temperatures for the season were 1.57°C above the 1961–1990 average, surpassing the previous record of 1.43°C (set in 2006) by 0.14°C. Daytime maximum temperatures were also the highest on record, coming in 2.07°C above average and 0.24°C above the previous record (also set in 2006). Overnight minimum temperatures were the fourth-warmest on record with an anomaly of +1.07°C.
As described previously (see Australia’s warmest 12-month period on record) the warmth was most significant in September, which saw a mean temperature anomaly of +2.75°C, setting a new monthly record by more than a degree. At 1.43°C above average, October was also a very warm month. The spring warmth was extensive, with virtually the entire country experiencing above-average mean temperatures. Australian temperatures have warmed by about 1° C since 1910, with the warming being fastest during spring. NT Sea Surface Temperature. Sea-level Rise - CSIRO & ACECRC. We love the coast.
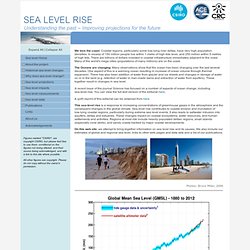
Coastal regions, particularly some low-lying river deltas, have very high population densities. In excess of 150 million people live within 1 metre of high tide level, and 250 million within 5 metres of high tide. There are billions of dollars invested in coastal infrastructure immediately adjacent to the coast. Many of the world's mega cities (populations of many millions) are on the coast. The Oceans are changing. A recent issue of the journal Science has focused on a number of aspects of ocean change, including sea-level rise.
A (pdf) reprint of this editorial can be obtained from here. Sea level rise in Kowanyama Qld. “When that whole ocean comes and rises up, where are we going to go?”
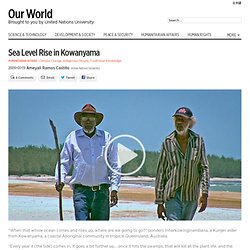
Ponders Inherkowinginambana, a Kunjen elder from Kowanyama, a coastal Aboriginal community in tropical Queensland, Australia. “Every year it (the tide) comes in, it goes a bit further up….once it hits the swamps, that will kill all the plant life, and the waterways,” adds an Aboriginal ranger who works with local elders to protect Aboriginal country and culture. These tidal changes are not unique to Australia. Global climate change is increasing sea level worldwide. Historically, scientists have documented a wide fluctuation in sea level rise. So how does climatic warming lead to sea level change? UNU - IAS. The following text describes how several international processes have acknowledged the need for further awareness and understanding of the relationship between indigenous peoples and climate change, including: Millennium Ecosystem Assessment Encouraged by the Millennium Ecosystem Assessment process and findings and the unprecedented attention given by the international community to climate change, a number of indigenous peoples’ organizations have sought to adapt and implement the Millennium Ecosystem Assessment conceptual framework and carry out local assessments.
The Vilcanota local assessment being carried out in Peru by Asociacion Andes and the Sustaining Local Foods Systems, Agrobiodiversity and Livelihoods Program of IIED, was identified as model for future local assessments. Consequently ANDES was asked by interested indigenous organizations to foster partnerships with research institutions and donor agencies to support local indigenous assessments and disseminate their results. How much is sea level rising? Gavin Schmidt investigated the claim that tide gauges on islands in the Pacific Ocean show no sea level rise and found that the data show a rising sea level trend at every single station.
But what about global sea level rise? Sea level rises as ice on land melts and as warming ocean waters expand. As well as being a threat to coastal habitation and environments, sea level rise corroborates other evidence of global warming. Argo - part of the integrated global observation strategy. Ice isn't melting. Ice is melting at accelerating rates in the Arctic, Antarctica, Greenland, and glaciers all over the world.
Ice sheets are beginning to shrink An ice sheet is a huge layer of land ice. The only ice sheets are in Antarctica and Greenland. The Greenland ice sheet is losing mass at an accelerating rate. In recent years the ice loss has spread from the south coast around to the northwest. (Image source: Climate Signals.) Similarly, Antarctica is also losing ice at an accelerating rate. (Image source: NASA.) Ice shelves are collapsing. When Sea Levels Attack! Sea level change: estimations and predictions. GBRMPA. Marine WATERs. Ocean Health Index. Chasing Ice.