
R-Forge: Sequence analysis for social scientists: R Development Page. Cran.r-project.org/web/packages/cpm/vignettes/cpm. How to Read Histograms and Use Them in R. The histogram is one of my favorite chart types, and for analysis purposes, I probably use them the most.
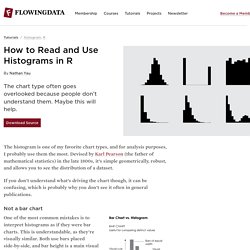
Devised by Karl Pearson (the father of mathematical statistics) in the late 1800s, it's simple geometrically, robust, and allows you to see the distribution of a dataset. If you don't understand what's driving the chart though, it can be confusing, which is probably why you don't see it often in general publications. Not a bar chart One of the most common mistakes is to interpret histograms as if they were bar charts.
This is understandable, as they're visually similar. The main difference, shown in the graphic on the right, is that bar charts show categorical data (and sometimes time series data), whereas histograms show a continuous variable on the horizontal axis. This means you read the two chart types differently. Although bar widths are typically the same width.Finally, because histograms use area instead of height to represent values, the width of bars can vary. Wrapping up. Using Dates and Times in R. Today at the Davis R Users’ Group, Bonnie Dixon gave a tutorial on the various ways to handle dates and times in R.
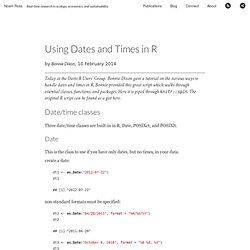
Bonnie provided this great script which walks through essential classes, functions, and packages. Here it is piped through knitr::spin. The original R script can be found as a gist here. Date/time classes Three date/time classes are built-in in R, Date, POSIXct, and POSIXlt. Date This is the class to use if you have only dates, but no times, in your data. create a date: dt1 <- as.Date("2012-07-22") dt1.
rMaps - Interactive Maps from R. Swirl - Home. Learn R interactively with the swirl package. How to Map Geographic Paths in R. Beta. Cookbook for R » Cookbook for R. R Programming Language. Alyssa frazee. Thu 02 January 2014 | -- (permalink) My sister is a senior undergraduate majoring in sociology.
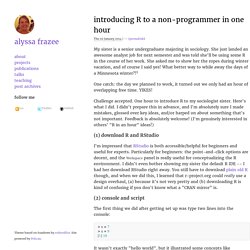
She just landed an awesome analyst job for next semester and was told she'll be using some R in the course of her work. She asked me to show her the ropes during winter vacation, and of course I said yes! What better way to while away the days of a Minnesota winter?! 1 One catch: the day we planned to work, it turned out we only had an hour of overlapping free time. Challenge accepted. . (1) download R and RStudio I'm impressed that RStudio is both accessible/helpful for beginners and useful for experts.
. (2) console and script The first thing we did after getting set up was type two lines into the console: It wasn't exactly "hello world", but it illustrated some concepts like "assignment" and "variables" and "evaluation"2. The next thing I had my sister do was save those two lines of code in an R script. . (3) comments # COMMENTS ARE SUPER IMPORTANT so we learned about them (4) graphics (5) getting help. WiSP Wildlife Simulation Package. WiSP is a library of functions to be used in conjunction with R software This software offers the ability for students and field researchers to investigate the behaviour of a variety of sampling schemes and estimators of density and abundance.
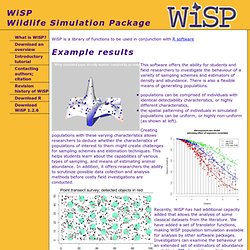
There is also a flexible means of generating populations. populations can be comprised of individuals with identical detectability characteristics, or highly different characteristics, the spatial patterning of individuals in simulated populations can be uniform, or highly non-uniform (as shown at left). Creating populations with these varying characteristics allows researchers to deduce whether the characteristics of populations of interest to them might create challenges for sampling schemes and estimation techniques.
This helps students learn about the capabilities of various types of sampling, and means of estimating animal abundance. Revisions to Version 1.2.6 May 2013, built under R version 3.0.1. Combining R and Python. Rpy.sourceforge.net.