
It Turns Out You Can Make Pretty Charts in Excel. Whenever we make graphs using Excel, they turn out pretty ugly.
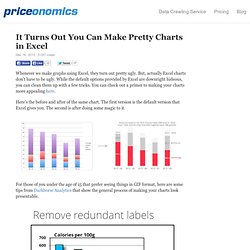
But, actually Excel charts don't have to be ugly. While the default options provided by Excel are downright hideous, you can clean them up with a few tricks. You can check out a primer to making your charts more appealing here. Here's the before and after of the same chart. The first version is the default version that Excel gives you. For those of you under the age of 15 that prefer seeing things in GIF format, here are some tips from Darkhorse Analytics that show the general process of making your charts look presentable. To get occasional notifications when we write blog posts, sign up for our email list. How to Prep for a Presentation. PowerPoint 2013: See What's Coming with Presenter View. One of the most common questions in PowerPoint training is “how can I see something different on my screen to the audience?”

The answer is complicated and involves multiple graphics card outputs. The Presenter View was added in 2010 but has really come into it’s own in PowerPoint 2013. In Presenter View you can see the current slide as well as the next slide and your notes on your monitor whilst the audience only sees the current slide. This is one of my favourite additions to PowerPoint as you are certain what is coming next, avoiding that embarrassing flicking between slides as you work out where that topic is. There’s a whole bunch of other tools underneath the main thumbnail, such as being able to zoom into slides to add emphasis, display a laser pointer to draw attention, and jump around the presentation without the delegates seeing what you’re doing. How to: The Presenter View will be used by default.
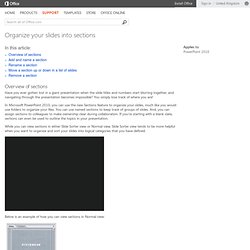
Organize your slides into sections - PowerPoint. In this article: Overview of sections Have you ever gotten lost in a giant presentation when the slide titles and numbers start blurring together, and navigating through the presentation becomes impossible?
Using Slide Masters in PowerPoint 2003. 7 Steps to Giving a Killer PowerPoint Presentation. Widely accepted as the most useful and accessible way to create visual aids ready to share with an audience, PowerPoint presentations are often poorly constructed making them boring and arduous to sit through.
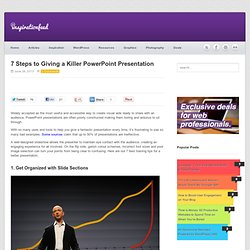
With so many uses and tools to help you give a fantastic presentation every time, it’s frustrating to see so many bad examples. Some sources claim that up to 50% of presentations are ineffective. A well-designed slideshow allows the presenter to maintain eye contact with the audience, creating an engaging experience for all involved. On the flip side, garish colour schemes, incorrect font sizes and poor image selection can turn your points from being clear to confusing. Here are our 7 best training tips for a better presentation. 1.
Ok, so this one is obvious but you’ll be surprised how many people dive straight into creating a presentation without setting a plan and laying out the groundwork. 5 killer ways to open up your next presentation. How Can I Make My PowerPoint Presentations Amazing? How to create a visualization. Over the last few years I’ve created a few popular visualizations, a lot of duds, and I’ve learned a few lessons along the way.
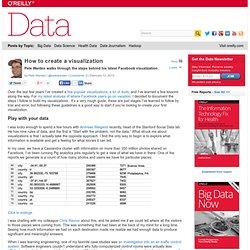
For my latest analysis of where Facebook users go on vacation, I decided to document the steps I follow to build my visualizations . It’s a very rough guide, these are just stages I’ve learned to follow by trial and error, but following these guidelines is a good way to start if you’re looking to create your first visualization. Play with your data I was lucky enough to spend a few hours with Andreas Weigend recently, head of the Stanford Social Data lab. He has nine rules of data, and the first is “Start with the problem, not the data.”
In my case, we have a Cassandra cluster with information on more than 350 million photos shared on Facebook. Click to enlarge. I was chatting with my colleague Chris Raynor about this, and he asked me if we could tell where all the visitors to those places were coming from. David S. Rose on pitching to VCs. Nancy Duarte: The secret structure of great talks. How to Avoid Death by PowerPoint. How GitHub Uses GitHub to Build GitHub. How GitHub Uses GitHub to Build GitHub. Slide Design for Developers. So I gave this talk called How GitHub Uses GitHub to Build GitHub.
Someone submitted my slides to Hacker News, where it stayed at #1 for most of the day. This was pretty strange to me at first. My slides are not designed for people who didn't see the talk in person. They're designed to support my words, not some online audience. What's more, many commented that they found the design of the slides to be noteworthy. Working on your slide design pays off for the audience in front of you and for the audience online reading your slides later. Colors Color is the very first thing people will notice. Quick Practical, Tactical Tips for Presentations.
In the past I’ve given some tips for handling meetings effectively, covering topics like: - How not to let your meeting go down a rat hole; - Dealing with the elephant in the room; - Dealing with skeletons in your closet; - How to make meetings discussions, not “pitches” - A tale of two pitches (I eventually invested in the first company that pitched)

Seth Godin: How To Do PowerPoint [Headlines] Self-Description. Swiss Group Wants to Banish PowerPoint. While most people might not love using Microsoft's PowerPoint to create presentations, at least one person is taking his distaste for the software to a global level.

Matthias Poehm, a former software engineer-turned-public speaking trainer has started -- yes -- the Anti-PowerPoint Party (APPP) earlier this month. Headquartered in Bonstetten, Switzerland, the APPP calls itself an "international movement" that intends to "decrease the number of boring presentations worldwide.
" The goal is to make it so that people who don't want to use PowerPoint "will not have to justify themselves in the future," it says. Right. Here's the real kicker: The APPP says people who attend "futile" PowerPoint presentations result in almost $500 billion in hourly wage losses for employers worldwide. While an APPP representative didn't immediately return an email seeking comment, the statistics above seem to originate from Poehm's book, "The PowerPoint Fallacy. " Keep it short. Don't be long-winded. Create Video Slideshows - Style Selector.
Do's and Dont's of Making Awesome Diagrams for Slides. Yeah. I do loads of slide decks each year for several companies and there are two types of decks I do a lot. One is the presentation. One is the infodeck, which is really intended more as a document for distribution than as a presentation. The trouble is when I run into people who I can't convince there should be a difference.
And those people are usually managers commissioning the deck and not the presenters that will be using them. How to make Awesome Diagrams for your slides. How to Create Presentations that Don't Suck. Impress dual monitor operation. Killer Presentation Skills