
A Periodic Table of Visualization Methods. Data Visualization. About The Author Vitaly Friedman loves beautiful content and doesn’t like to give in easily. When he is not writing or speaking at a conference, he’s most probably running … More about Vitaly Friedman … Data presentation can be beautiful, elegant and descriptive. There is a variety of conventional ways to visualize data - tables, histograms, pie charts and bar graphs are being used every day, in every project and on every possible occasion. However, to convey a message to your readers effectively, sometimes you need more than just a simple pie chart of your results. Mapping the Stairs to Visual Excellence. Visualization Methods. A Directory of Visualizing Tools. Update Feb 2007: Just came across some cool stuff from digg labs (the guys behind digg) who haev some coold stuff I’ve added below.

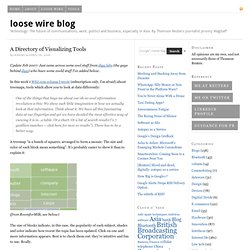
In this week’s WSJ.com column I wrote (subscription only, I’m afraid) about treemaps, tools which allow you to look at data differently: One of the things that bugs me about our oh-so-cool information revolution is this: We show such little imagination in how we actually look at that information. Think about it. Value based Mgt Methods. Mind Tools. Many Eyes.