
R & Bioconductor - Manuals. NG Sequence - Manuals. Introduction [ Sequencing Technologies ] [ Latest Slides from NGS Analysis Workshop ] High throughput sequencing (HT-Seq or HTS), also known as next generation sequencing (NGS), presents a wide spectrum of opportunities for genome research. Unfortunately, many existing bioinformatic tools do not scale well to large datasets consisting of tens of millions of sequences generated by technologies like Illumina/Solexa, Roche/454, ABI/SOLiD and Helicos. The Bioconductor project fills this gap by providing a rapidly growing suite of well designed R packages for analyzing traditional and HT-Seq datasets. These 'BioC-Seq' packages allow to analyze these sequences with impressive speed performance. BiocViews. Perl中国. Using R for statistical analyses - Analysis of Variance. ANOVA One-way Analysis of variance and regression have much in common.
Both examine a dependent variable and determine the variability of this variable in response to various factors. The simplest ANOVA would be where we have a single dependent variable and one single factor. For example, we may have raised broods of flies on various sugars. We measure the size of the individual flies and record the diet for each. Legends (ggplot2) This page was recently updated to reflect changes in the new version of ggplot2, 0.9.3.
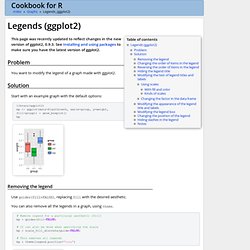
See Installing and using packages to make sure you have the latest version of ggplot2. Problem You want to modify the legend of a graph made with ggplot2. Solution Start with an example graph with the default options: library(ggplot2) bp <- ggplot(data=PlantGrowth, aes(x=group, y=weight, fill=group)) + geom_boxplot() bp Removing the legend Use guides(fill=FALSE), replacing fill with the desired aesthetic. You can also remove all the legends in a graph, using theme.
Colors (ggplot2) Problem You want to use colors in a graph with ggplot2.
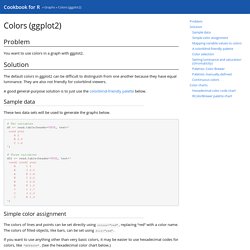
Solution The default colors in ggplot2 can be difficult to distinguish from one another because they have equal luminance. Workflows. ArrayExpress Query Help - Programmatic Access. 1.
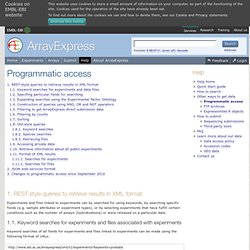
REST-style queries to retrieve results in XML format 1.1. A TikZ tutorial: Generating graphics in the spirit of TeX. Science: Biology: Bioinformatics: Software. Graphic Displays & Dynamic Graphics & Graphic Devices & Visualization. R is rich with facilities for creating and developing interesting graphics.
Base R contains functionality for many plot types including coplots, mosaic plots, biplots, and the list goes on. There are devices such as postscript, png, jpeg and pdf for outputting graphics as well as device drivers for all platforms running R. lattice and grid are supplied with R's recommended packages and are included in every binary distribution. lattice is an R implementation of William Cleveland's trellis graphics, while grid defines a much more flexible graphics environment than the base R graphics.
R's base graphics are implemented in the same way as in the S3 system developed by Becker, Chambers, and Wilks. There is a static device, which is treated as a static canvas and objects are drawn on the device through R plotting commands. The device has a set of global parameters such as margins and layouts which can be manipulated by the user using par() commands. Statistics, R, Graphics and Fun. R & Bioconductor - Manuals. ( Slide Show ) R contains many functions and libraries for clustering of large data sets.
A very useful overview of clustering utilities in R is available on the Cluster Task Page and for machine learning algorithms on the Machine Learning Task Page and the MLInterfaces package. Generate a sample data set Data centering and scaling Obtain a distance matrix. Bootstrapping. Nonparametric Bootstrapping The boot package provides extensive facilities for bootstrapping and related resampling methods.
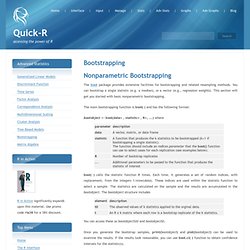
You can bootstrap a single statistic (e.g. a median), or a vector (e.g., regression weights). This section will get you started with basic nonparametric bootstrapping. The main bootstrapping function is boot( ) and has the following format: Biology Foundation Training. The Microsoft Biology Foundation (MBF) is a language-neutral bioinformatics toolkit, built as an extension to the Microsoft .NET Framework, and initially aimed at the area of Genomics research.
On this page, you can find slides and hands-on labs to help you get started with MBF. You can also view the MBF tutorial introduction presentation from the Microsoft Research eScience Workshop 2010. Visit Microsoft Biology Foundation to install, download, learn more about MBF, and to find sample tools and applications built on MBF. MBF is part of the Microsoft Biology Initiative. Module 1: Introduction to the Microsoft Biology Foundation and Command Line Tools. Bioconductor - Home. R Programming. Welcome to the R programming Wikibook This book is designed to be a practical guide to the R programming language[1].
R is free software designed for statistical computing. There is already great documentation for the standard R packages on the Comprehensive R Archive Network (CRAN)[2] and many resources in specialized books, forums such as Stackoverflow[3] and personal blogs[4], but all of these resources are scattered and therefore difficult to find and to compare. The aim of this Wikibook is to be the place where anyone can share his or her knowledge and tricks on R.
It is supposed to be organized by task but not by discipline[5]. How can you share your R experience ? Explain the syntax of a commandCompare the different ways of performing each task using R.Try to make unique examples based on fake data (ie simulated data sets).As with any Wikibook please feel free to make corrections, expand explanations, and make additions where necessary. Some rules : Prerequisites[edit] See also[edit] R Graphical Manual. Cluster Analysis & Finite Mixture Models. This CRAN Task View contains a list of packages that can be used for finding groups in data and modeling unobserved cross-sectional heterogeneity.
Many packages provide functionality for more than one of the topics listed below, the section headings are mainly meant as quick starting points rather than an ultimate categorization. Except for packages stats and cluster (which ship with base R and hence are part of every R installation), each package is listed only once. Most of the packages listed in this CRAN Task View, but not all are distributed under the GPL. Please have a look at the DESCRIPTION file of each package to check under which license it is distributed. Hierarchical Clustering: Functions hclust() from package stats and agnes() from cluster are the primary functions for agglomerative hierarchical clustering, function diana() can be used for divisive hierarchical clustering.
5 Minute Analysis in R: Case-Shiller Indices » stotastic. R Graphical Manual.