
Confusing Statistical Terms #1: The Many Names of Independent Variables. Statistical models, such as general linear models (linear regression, ANOVA, mixed models) and generalized linear models (logistic, Poisson, proportional hazard regression, etc.) all have the same general form.
On the left side of the equation is one or more response variables, Y. On the right hand side is one or more predictor variables, X, and their coefficients, B. X, the variables on the right hand side can have many forms and are called by many names. Webinar Recordings. 7 Practical Guidelines for Accurate Statistical Model Building. Model Building–choosing predictors–is one of those skills in statistics that is difficult to teach.
It’s hard to lay out the steps, because at each step, you have to evaluate the situation and make decisions on the next step. If you’re running purely predictive models, and the relationships among the variables aren’t the focus, it’s much easier. Go ahead and run a stepwise regression model. Let the data give you the best prediction. But if the point is to answer a research question that describes relationships, you’re going to have to get your hands dirty. It’s easy to say “use theory” or “test your research question” but that ignores a lot of practical issues. Or that you could, theoretically, make the case for all 40 demographic control variables. So how do you do it? The Top Resources Ebook. 7 Statistical Issues that Researchers Should Not Worry So Much About. The 13 Steps for Statistical Modeling in any Regression or ANOVA.
No matter what statistical model you’re running, you need to go through the same 13 steps.
The order and the specifics of how you do each step will differ depending on the data and the type of model you use. These 13 steps are in 3 major parts. Most people think of only Part 3 as modeling. However, if you do all 3 parts, and think of them all as part of the analysis, the modeling process will be faster, easier, and make more sense. Part 1: Define and Design In the first 4 steps, the object is clarity. 1. A lot of times, when researchers are confused about the right statistical method to use, the real problem is they haven’t defined their research questions. For each research question, write it down in both theoretical and operational terms. 2. Depending on whether you are collecting your own data or doing secondary data analysis, you need a clear idea of the design. 3.
Every model has to take into account both the design and the level of measurement of the variables. Interpreting Regression Coefficients. Linear regression is one of the most popular statistical techniques used by researchers.
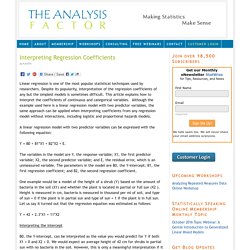
Despite its popularity, interpretation of the regression coefficients of any but the simplest models is sometimes difficult. This article explains how to interpret the coefficients of continuous and categorical variables. Although the example used here is a linear regression model with two predictor variables, the same approach can be applied when interpreting coefficients from any regression model without interactions, including logistic and proportional hazards models. A linear regression model with two predictor variables can be expressed with the following equation:
Can Likert Scale Data ever be Continuous? A very common question is whether it is legitimate to use Likert scale data in parametric statistical procedures that require interval data, such as Linear Regression, ANOVA, and Factor Analysis.
A typical Likert scale item has 5 to 11 points that indicate the degree of agreement with a statement, such as 1=Strongly Agree to 5=Strongly Disagree. It can be a 1 to 5 scale, 0 to 10, etc. The issue is that despite being made up of numbers, a Likert scale item is in fact a set of ordered categories. One camp maintains that as ordered categories, the intervals between the scale values are not equal.
Any mean, correlation, or other numerical operation applied to them is invalid. The other group maintains that while technically the Likert scale item is ordered, using it in parametric tests IS valid in some situations. Meanwhile, the debate rages on. What is a researcher with integrity supposed to do? Understand the difference between a Likert type item and a Likert Scale. Jamieson, S. (2004).
Likert Scale Items as Predictor Variables in Regression. I was recently asked about whether it’s okay to treat a likert scale as continuous as a predictor in a regression model.
Here’s my reply.