
Pricing. You’ve got options with Infogram.
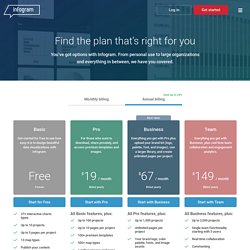
From personal use to large organizations and everything in between, we have you covered. Basic Get started for free to see how easy it is to design beautiful data visualizations with Infogram. Start for Free 37+ interactive charts types Up to 10 projects Up to 5 pages per project 13 map types Publish your content online Import data Object animations Pro. Knowledge base. PanelPicker. Voting period for this idea type has passed There are seven deadly mistakes made consistently by both expert and novice infographic designers.

When an infographic is False, Haphazard, Textual, Questionable, Confusing, Repetitive, or Verbose it’s highly likely that the audience will ignore your design, and you can severely hurt your credibility. A well designed infographic is easy to read and much more likely to be remembered by the audience. 20+ Tools to Create Your Own Infographics.
A picture is worth a thousand words – based on this, infographics would carry hundreds of thousands of words, yet if you let a reader choose between a full-length 1000-word article and an infographic that needs a few scroll-downs, they’d probably prefer absorbing information straight from the infographic. What’s not to like? Colored charts and illustrations deliver connections better than tables and figures and as users spend time looking back and forth the full infographic, they stay on the site longer.
Plus, readers who like what they see are more likely to share visual guides more than articles. 30 Templates & Vector Kits to Design Your Own Infographic. Infographics are always fun to read.
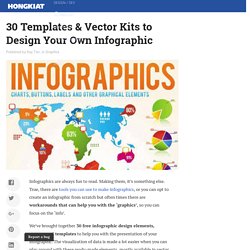
Making them, it’s something else. Create Interactive Online Presentations, infographics, animations & banners in HTML5 - Visme by Easy WebContent. Piktochart - Create Easy Infographics, Reports, Presentations. Create and share visual ideas online. Original Content Marketing for Brands. For Education. Make Beautiful Infographics.
NCLTI-PhaseII - Infographics. Chart Gallery - Google Charts. How To Create Outstanding Modern Infographics. In this tutorial you will learn that data doesn't have to be boring, it can be beautiful!

Learn how to use various graph tools, illustration techniques and typography to make an accurate and inspiring infographic in Adobe Illustrator. Start by using the Rectangle Tool (M) to draw a shape. Give it a subtle radial gradient too. The entire design is based on a grid of four columns. To make the columns first select the rectangle and drag a guide onto the centre of the shape. Condense the shape so it fits within the left-most guide and centre guide. Move the shape over to the right and add another guide to the centre here. Using the Rectangle Tool (M) draw a thin white box on the centre line that will be the width of the gap between the columns. Repeat the process for the other columns with your final result being below.
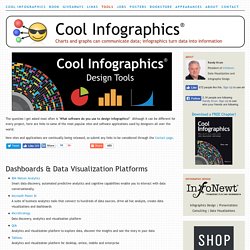
I like to place the most important graphics first and work-in the ancillary charts and graphs afterwards. Give the circles a variety of gradients. That's it! 9 Powerful Free Infographic Tools To Create Your Own Infographics - DATA VISUALIZATION.
Infographic Tools. Love Chrome, But Love Your Privacy And Security Even More? Try Aviator. We live within our web browsers.

You’re reading this article in a web browser. You probably check your email in a web browser. I order my groceries in a web browser. I buy books in a web browser. Web browsers are pretty important. But we never really think about them within the context of security and privacy. With that in mind, imagine my delight when I discovered the Aviator web browser, by WhiteHat Security. A Pedigree To Be Proud Of We’re all familiar with Google Chrome. Furthermore, Chrome is fast. But what of WhiteHat Sec? The Perks Of Using Aviator. Turbo Visualization in the Cloud. ChartsBin.com - Visualize your data. ChartGo - Graph and Charts Fast, Easy and Free.
Draw Freely. Create infographics easily, visually. By PixCone. Tools - Cool Infographics. Adioma creates information graphics out of your textual data, using timelines, grids and icons.
Create impressive charts from spreadsheets. Assemble into dashboards, embed in websites, or simply share a link. A Python interactive visualization library that targets modern web browsers for presentation Cacoo is a free online drawing tool that allows you to create a variety of diagrams such as site map, flowchart, mind map, wire frame, UML diagram and network diagram. Crowdsourced Analytics Solution Marketplace - Make Sense of Big Data Free interactive charts created online in seconds ChartGo is an online graph maker tool. 5 Infographics to Teach You How to Easily Create Infographics in PowerPoint [+ TEMPLATES] Despite the spattering of headlines that have popped up over the past couple years proclaiming "infographics are dead," infographics are, in fact, alive and well.
![5 Infographics to Teach You How to Easily Create Infographics in PowerPoint [+ TEMPLATES]](http://cdn.pearltrees.com/s/pic/th/infographics-powerpoint-52355193)
We just checked -- they're totally healthy. I mean, there are a lot of them, but when marketers spend the time aligning the topic, content, and style of their infographics with the needs and preferences of their target audiences, they're still finding success. (And by "success" I mean driving traffic -- and potential leads -- to their websites and generating social buzz through people sharing and commenting.) A 2014 study shows that the use of infographics among B2B marketers increased 9% from 2013 to 2014: from 43% adoption to 52% adoption. And a recent report from Social Media Examiner shows that original, visual content is the number one form of content that marketers want to learn more about in 2015.
30 Templates & Vector Kits to Design Your Own Infographic. How To Design Your Own Infographics. Introduction Infographics seem to be a real trend today, with new ones popping up daily on all sorts of subjects.
From mortgages to ice cream, estimating software to infographics about infographics, there is very little now that hasn't been 'visualised' in some form. Many people don't realise that the term information graphic, or 'infographic' was first coined over 100 years ago, with the Coxcomb chart by Florence Nightingale in 1857 being one of earliest recognised examples. They have existed in many forms since then, but only in the past few years have infographics developed into the art form we know today.
However, they suit the information heavy world we live in as they give an easily understandable visual snapshot of something that may otherwise be plain text, and can help to widen the audience of a subject. Make Beautiful Infographics. Many Eyes. 10 Awesome Free Tools To Make Infographics. Advertisement Who can resist a colourful, thoughtful venn diagram anyway?

Juice Labs - Chart Chooser. How To Design Your Own Infographics. 46 Tools To Make Infographics In The Classroom. Infographics are interesting–a mash of (hopefully) easily-consumed visuals (so, symbols, shapes, and images) and added relevant character-based data (so, numbers, words, and brief sentences).
The learning application for them is clear, with many academic standards–including the Common Core standards–requiring teachers to use a variety of media forms, charts, and other data for both information reading as well as general fluency. It’s curious they haven’t really “caught on” in schools considering how well they bridge both the old-form textbook habit of cramming tons of information into a small space, while also neatly overlapping with the dynamic and digital world. S Infographic App - Education pricing plan. How-to-create-5-fabulous-infographics-final. Instructional Screencast:Infogr.am. Tools - Cool Infographics. Adobe Illustrator tutorial: Create cool infographics. 46 Tools To Make Infographics In The Classroom.