
Spice Up Your English Class: 7 ways to use INFOGRAPHICS in the English classroom. This is my first post of 2014 and I'd like to kick off the new year by writing about the latest popular phenomenon on the web: INFOGRAPHICS.
What is an infographic? An Infographic (information graphic) is a visual representation of a data set or instructive material. It takes a large amount of information in text or numerical form and then condenses it into a combination of images and text, allowing viewers to quickly grasp the essential insights the data contains. Can infographics be used in the English classroom?
Yes, of course. 1. 2. 3. 4. 5. 6. 7. The 7 Best Fail-Safe Tips for Creating Standout Infographics. 30 Filler Words To Cut Out Of Your Writing (Infographic) – Writers Write. What is a padding or filler word?
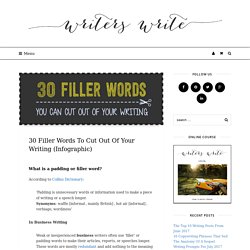
According to Collins Dictionary: ‘Padding is unnecessary words or information used to make a piece of writing or a speech longer.Synonyms: waffle [informal , mainly British] , hot air [informal] , verbiage, wordiness’ In Business Writing Weak or inexperienced business writers often use ‘filler’ or padding words to make their articles, reports, or speeches longer. Infographic Design - Tips and Inspiration By Canva. Infographics. Infographics as a Creative Assessment. CompleteGuideToInfographics. InfographicsForYourClassroom. The 13 Step Guide to Building an Infographic. The Simple Infographic Structure. DTL - Bring Data to Life Using Infographics. Skip to main content guest Join | Help | Sign In DTL Home guest| Join | Help | Sign In HOMEDTL DirectoryDTL WebsiteDTL InSights NewsletterSchool Library MediaITF ConnectNCWiseOwlHome BaseITES StandardsITES WikiNC DLMI (New AMTR)Professional StandardsProfessional EvaluationIntel TeachDTL Statewide EventsProfessional DevelopmentPRC 15Digital Learning DaySpeak Up 2015NCEdCloudNC Digital Learning PlanNC Digital Learning Rubric The digital resources included on this wiki have been helpful to some educators across the state.
Turn off "Getting Started" Loading... PanelPicker. Voting period for this idea type has passed There are seven deadly mistakes made consistently by both expert and novice infographic designers.
CompleteGuideToInfographics. Visual Thinking. Home » All CFT Teaching Guides » Visual Thinking by CFT graduate program coordinator Maria Ebner & assistant director Derek Bruff Introduction Our brains are wired to rapidly make sense of and remember visual input.
Visualizations in the form of diagrams, charts, drawings, pictures, and a variety of other ways can help students understand complex information. A well-designed visual image can yield a much more powerful and memorable learning experience than a mere verbal or textual description. Below you’ll find resources for integrating visual thinking in your teaching. On March 17, 2010, the CFT hosted a workshop on this topic. For more notes from the workshop, as well as ideas participants generated during the workshop, see the bottom of this page. Images as Metaphors Presentation Zen: Garr Reynolds, author of Presentation Zen, maintains a blog in which he writes about effective presenting. Flickr: A great source for free, high-quality images is Flickr, the photo-sharing site. What Is An Infographic And Why Are They So Popular? - Performancing.
Icon Archive - Search 551,002 free icons, desktop icons, download icons, social icons, xp icons, vista icons. Infographic of Infographics. NCLTI-PhaseII - Infographics. How To Create Outstanding Modern Infographics. In this tutorial you will learn that data doesn't have to be boring, it can be beautiful!

Learn how to use various graph tools, illustration techniques and typography to make an accurate and inspiring infographic in Adobe Illustrator. Start by using the Rectangle Tool (M) to draw a shape. Give it a subtle radial gradient too. The entire design is based on a grid of four columns. Infographics Only. Classroom21 - Implement 21st Century Skills With Infographics. Social Studies, History, Economics. Science and Health Infographics From The New York Times. September 1, 2010 | Updated On Monday we kicked off “infographics week” on the blog.
Yesterday we ran down some of the best infographics on NYTimes.com for teaching social studies, current events, politics, history and economics. Tomorrow we’ll provide a list for language arts and fine arts. Language Arts, Fine Arts and Entertainment. InfoGraphic Designs: Overview, Examples and Best Practices. Information graphics or infographics are visual representations of information, data or knowledge.
These graphics are used where complex information needs to be explained quickly and clearly, such as in signs, maps, journalism, technical writing, and education. They are also used extensively as tools by computer scientists, mathematicians, and statisticians to ease the process of developing and communicating conceptual information. They can present a rich amount of information without intimidating you. Or sometimes they intimidate you, but make the digesting of the information much more bearable. Here in this article below, we are going to discuss best practices for designing infographics followed by some examples which might help you learn a thing or two. You may be interested in the following related articles as well. 10 Awesome Free Tools To Make Infographics.
Advertisement Who can resist a colourful, thoughtful venn diagram anyway?

In terms of blogging success, infographics are far more likely to be shared than your average blog post. This means more eyeballs on your important information, more people rallying for your cause, more backlinks and more visits to your blog. In short, a quality infographic done well could be what your blog needs right now. Designing An Infographic. The Anatomy Of An Infographic: 5 Steps To Create A Powerful Visual.
Information is very powerful but for the most bit it is bland and unimaginative.

Infographics channel information in a visually pleasing, instantly understandable manner, making it not only powerful, but extremely beautiful. Once used predominantly to make maps more approachable, scientific charts less daunting and as key learning tools for children, inforgraphics have now permeated all aspects of the modern world. I designed a couple of infographics back in college, the need arising especially around the time Soccer World Cup fever spiked. It was a fun process representing the different groups, predicting winners in each group at each stage and creating a mock pairing of teams that would clash all the way leading upto the finals.
Helping students interpret visual representations of information. Update: Feb. 29, 2012 Please note: The original video we used for this post was a video podcast by Gestalten TV in which New York Times Graphics Director Steven Duenes and Graphics Editor Archie Tse describe how their team works with breaking news to create clear, concise visualizations of data for readers.
Since that has now been taken down, we have substituted a classic TED talk by David McCandless that we refer to in the post. We’re declaring this week Infographics Week on The Learning Network because we know how important it is for students to be able to read and interpret visual representations of information — and because The New York Times consistently creates useful and elegant examples that we think teachers across the curriculum should know about. Not only do charts, graphs and maps show up on standardized tests of all kinds, but whiteboard technology has made the graphic depiction of information that much more useful and ubiquitous in classrooms. Info-what? Developing visual literacy through infographics. The need to be visually literate in the 21st century is continuing to grow.
“In an uncharted world of boundless data, information designers are our new navigators,” begins a recent Times article, “When the Data Struts Its Stuff.”To bring home just how important it is to be able to navigate through a sea of data, check out how much content is created in just sixty seconds online: Now imagine trying to communicate even this information in any way other than visual…. To prepare students to be ‘successful learners, confident and creative individuals and active and informed citizens’ (Melbourne Declaration), they must be able to comprehend, interpret and extrapolate from information presented in a wide variety of formats.
How To Design Your Own Infographics. Introduction Infographics seem to be a real trend today, with new ones popping up daily on all sorts of subjects. From mortgages to ice cream, estimating software to infographics about infographics, there is very little now that hasn't been 'visualised' in some form. Infographic. Information graphics or infographics are graphic visual representations of information, data or knowledge intended to present complex information quickly and clearly.[1][2] They can improve cognition by utilizing graphics to enhance the human visual system’s ability to see patterns and trends.[3][4] The process of creating infographics can be referred to as data visualization, information design, or information architecture.[2] Overview[edit] Infographics have been around for many years and recently the proliferation of a number of easy-to-use, free tools have made the creation of infographics available to a large segment of the population.
Infographics Webinar.mp4. How Real Kids Create Real Infographics. Infographics are a visually stunning way to deliver facts and statistics to readers. They have become incredibly popular recently on Pinterest, Twitter, and lots of other social media tools because users are looking for a quick way to get reliable information. Great infographics answer questions that people are interested in answering. They also require lots of research, reading, and analysis to create. Sounded like a perfect activity for my students--and it could be for yours as well!
Lesson Preparation Essential Question First, I needed to create an essential question. How did the differences between the North and South affect each region's strategy and success in the Civil War? Data Visualization: Modern Approaches. About The Author Vitaly Friedman loves beautiful content and doesn’t like to give in easily. When he is not writing or speaking at a conference, he’s most probably running … More about Vitaly Friedman … Interactive Infographic - 13 Reasons Why Your Brain Craves Infographics. 10 Reasons Why Infographics Work & What Makes Them Go Viral. Why Infographics Rule. 10 Reasons Why Infographics are Important. The Most Important Thing You Need to Know about Infographics. Blog: A Modern and Reusable Approach to Visual Content: Data Driven Infographics. Dataesthetics: The Power and Beauty of Data Visualization. Visual Data.
Blog About Infographics and Data Visualization - Cool Infographics. The Anatomy Of An Infographic: 5 Steps To Create A Powerful Visual. Adobe Illustrator tutorial: Create cool infographics. Search images on VisualizeUs. Hans Rosling: The best stats you've ever seen. How To Create Outstanding Modern Infographics. InfoGraphic Designs: Overview, Examples and Best Practices. Infographics. Translating an Essay Into an Infographic. When introducing the assignment review the guidelines for infographic creation on Spyre studios website as a class. You might also review some infographics online, but this can be more intimidating to students than the Spyre guide because many of them (a) deal with complex statistics rather than ideas and (b) are professionally produced by Photoshop experts.
The Spyre guide is efficient, concise, and clear without being intimidating. Discuss the components of an infographic. A history teacher uses the oil spill for a student design project. Your Students Can Easily Create Infographics. A Periodic Table of Visualization Methods. Student Designed Infographics: Process & Products. Last year my students designed infographics for the first time. I enjoyed the process and the products. How to Teach Without a Lecture and other fun.