
d3.js: force layout; click to group/bundle nodes; multiple relations. Derived from the D3.js example force_cluster.html and gist 3071239.
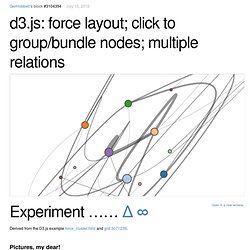
Pictures, my dear! See the graph in various states of undress, click to see the full-rez centerfold: Usage Click on node to expand or collapse. When a node has 'bundled' outgoing links, the first click will expand only those (a.k.a. 2nd display mode / expand state = 1), the next click will then expand the group node itself.Click on hull (which shows up when you expanded a group node) to collapse the group.Drag node to move entire graph around. Notes network() is the one who takes care of (re)generating the nodes and links from the original data, based on the expand[] info, i.e. which group(s) should be shown in expanded form and which shouldn't.only group nodes are expected to have a .size attribute (read: your own JSON should use that attribute for any node).
Tuning The Darn Thing Heck, every node set will need its own tweaks and tugs if you want to have it look exactly right all the time. Edit this Fiddle. Song Networks: Interative Network Tutorial. April 2012. Now as promised, here is some example code that builds on top of the d3 examples. I will start with the 'Force directed layour (with labels & images)', then add a coloured circle on each node and as well add some code to bound the nodes and links to within the SVG canvas, taking inspiration from another example 'Bounded force layout'. Let's walk through the code. First, the headers including the latest d3.js files, and some CSS: Create the SVG canvas and attach it to the tag declare above.
Here we need to add a colour scheme, d3.scale.category20() is quite nice. Var w = 960, h = 500, r = 10, fill = d3.scale.category20(); var vis = d3.select("body").append("svg:svg") .attr("width", w) .attr("height", h); Each node is assigned a number according to its place in the nodes array, the links use these numbers in their 'source' and 'target' fields to create a connection. Select all the links and create them, here 'd' represents the link when inside functions: Select all the nodes and create them: D3.js with force direct graph with support for drag and drop to make node fixed ( ) Exemples. Chicago Lobbyists Force-Directed Graph Visualization. Created by Christopher Manning Summary This visualization includes the 50 highest paid lobbyists in Chicago, their clients, and the agencies they lobby.
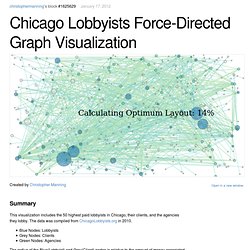
The data was compiled from ChicagoLobbyists.org in 2010. Blue Nodes: LobbyistsGrey Nodes: ClientsGreen Nodes: Agencies. Edit this Fiddle. d3.js - Constructing Force Directed Graphs From Only Link Data. Interactive Force-Directed Layout (D3) Twitter Smash. Highlight selected node, its links, and its children in a d3.js force directed graph. Force-Directed Layout with Append on Double-Click. Modifying a Force Layout.
A topic correlation network layout. Force-Directed Graph. Visualization - How can I append text to and render that text from a line in a force directed graph in D3.js. d3 force graph with fish eye, pan and zoom, and custom tool tip. Force-Directed Layout. Adding To and Removing From a Force Layout. Automatic floating labels using d3 force-layout. Combining D3 and Raphael to make a network graph « dataist. During the past week I have been working on a visualization for Sveriges Radio about Melodifestivalen, the Swedish qualification for the Eurovision Song Contest.
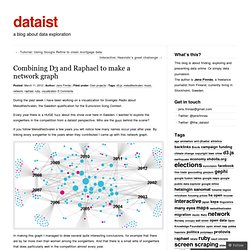
Every year there is a HUGE fuzz about this show over here in Sweden. I wanted to explore the songwriters in the competition from a dataist perspective. Who are the guys behind the scene? If you follow Melodifestivalen a few years you will notice how many names occur year after year. By linking every songwriter to the years when they contributed I came up with this network graph. In making this graph I managed to draw several quite interesting conclusions, for example that there are by far more men than women among the songwriters. But this is not what I wanted to blog about today, but rather about the making of this visualization. I have really come to like the Raphael.js library, but unfortunately it does not provide the same robust support for advanced data visualizations (for example network graphs) as its big brother D3.js.