

Free Infographic Maker. Top 11 Wonderful Tools for Designers To Create Infographics - I am programmer. For all the importance we place on text, it’s an indisputable fact that images are processed in the brain faster than words.

Hence the rise and rise of the infographic which, at its best, transforms complex information into graphics that are both easy to grasp and visually appealing. No wonder magazine readers and web visitors love them. 5 Presentation Tools That Will Make Your Slides Stand Out. By Adam Noar Like an elegantly crafted ham sandwich, cheeseburger, or croque monsieur, a good PowerPoint presentation is filled with yummy details that accentuate your talking points and keep your audience perked up and salivating to learn more.

This is why it’s so important to consider not only the content of your presentation, but also the way in which it is presented. Ever endure a monochrome presentation at a conference before? Even if it was about an interesting topic, chances are that you probably felt bored within a couple minutes. A well-thought out presentation design will make a ton of difference in captivating your audience and ensure that you don’t hear snoring during your presentation. 5 Infographics to Teach You How to Easily Make Infographics in PowerPoint [Free Templates] Despite the spattering of headlines that have popped up over the past couple years proclaiming "infographics are dead," infographics are, in fact, alive and well.
![5 Infographics to Teach You How to Easily Make Infographics in PowerPoint [Free Templates]](http://cdn.pearltrees.com/s/pic/th/infographics-powerpoint-52355193)
We just checked -- they're totally healthy. I mean, there are a lot of them, but when marketers spend the time aligning the topic, content, and style of their infographics with the needs and preferences of their target audiences, they're still finding success. (And by "success" I mean driving traffic -- and potential leads -- to their websites and generating social buzz through people sharing and commenting.) A 2014 study shows that the use of infographics among B2B marketers increased 9% from 2013 to 2014: from 43% adoption to 52% adoption. And a recent report from Social Media Examiner shows that original, visual content is the number one form of content that marketers want to learn more about in 2015. Download 10 free infographic templates here to help you create professional-looking infographics without a designer.
Research. Presenter - Prowise. Create Interactive Online Presentations, infographics, animations & banners in HTML5 - Visme by Easy WebContent. Create Interactive Online Presentations, infographics, animations & banners in HTML5 - Visme by Easy WebContent. PrimaryWall. Piktochart. חשוב מאוד. Crear diagramas online Colaboración en tiempo real. Infographics. 17 visualisation tools to make your data beautiful. You don’t need to be a seasoned data scientist or have a degree in graphic design in order to create incredible data visualisations.
It has become a lot simpler to mine your data and interpret your insights in an engaging, attractive, and most importantly easy to understand way. This is a list of various different free and premium tools and platforms available which will allow you to communicate data in a variety of different formats, from interactive charts, to infographics, to maps, to word clouds. Not all will be suitable for your particular data set or your audience, but its certainly worth experimenting with a few to seek out the most relevant.
Hopefully you’ll not only learn some new skills and find some new creative tools, but also learn something about your own data. Infogr.am At Infogr.am you can create interactive, embeddable infographics using more than 30 charts and six themes. Fusion Tables Piktochart dygraphs Timeline Leaflet Tagxedo Tagxedo is a simple to use word cloud generator. Powtoon - מדריך ליצירת מצגות וסרטים עם אנימציות. Create Interactive Online Presentations, infographics, animations & banners in HTML5 - Visme by Easy WebContent. Color harmonies: Essential tips for selecting colors. Color is often a critical factor in design.
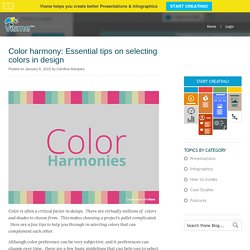
There are virtually millions of colors and shades to choose from. This makes choosing a project’s pallet complicated. Here are a few tips to help you through in selecting colors that can complement each other. Integrating Infographics into the iClassroom. So TechChef4U has caught the Infographics Influenza!
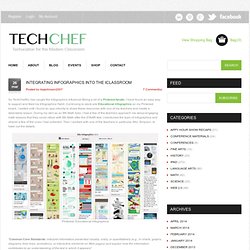
Being a bit of a Pinterest fanatic, I have found an easy way to support and feed my Infographics Habit. Continuing to stock pile Educational Infographics on my Pinterest board, I waited until I found an app-ortunity to share these resources with one of my teachers and create a delectable lesson. During my stint as an 8th Math tutor, I had a few of the teachers approach me about engaging math lessons that they could utilize with 8th Math after the STAAR test. I mentioned the topic of infographics and shared a few of the ones I had collected. Then I worked with one of the teachers in particular, Mrs. Mural.ly - Visual Collaboration for Creative People. SpiderScribe. Visual Thinking Center. 15 Effective Tools for Visual Knowledge Management. Since I started my quest a few years ago searching for the ultimate knowledge management tool, I’ve discovered a number of interesting applications that help people efficiently organize information.
There certainly is no shortage of solutions for this problem domain. Make a word cloud - WordItOut. מיומנויות למידה - הכנת שקפים ומצגות. להכין או לא להכין מצגת?

ישנן 3 סיבות מצוינות מדוע כדאי להשתמש במצגת במקביל להרצאה או הנחיית דיון: כי זה מייעל את התקשורת - המסר עובר בצורה יעילה ומהירה יותר, וקל יותר להשיג הסכמה על פרטים ועל רעיונות כאשר רואים בעיניים. כי זה עושה רושם טוב - במחקרים נמצא שכאשר המציג בא מוכן עם מצגת, הוא נתפס על ידי שומעיו כ - יותר אמין, יותר מקצועי, יותר משכנע ויותר מעניין. כי מצגת טובה משפרת את בטחונו העצמי של המציג! תהליך הכנת המצגת מכריח את המציג לארגן ולהכין עצמו טוב יותר לקראת ההצגה, הנקודות שבשקף מהוות תזכורת לדברים שרוצים להגיד ושומרות על מבנה ההצגה. אבל.... ראו הוזהרתם: אל תתנו ל"פירוטכניקה" להאפיל עליכם! מצגת טובה אמורה להשליםולא להחליף! חזרה למעלה עקרונות מנחים בעיצוב שקפים ומצגות. אינפוגרפיקה.pdf.
Augmented Reality. Create Interactive Online Presentations, infographics, animations & banners in HTML5 - Visme by Easy WebContent. Joomag - FREE Interactive Service for Digital Magazine publishing and hosting. Floor plans and interior design - Planner 5D. Design flyers to spread the word online. Educreations. Create and share visual ideas online. Movenote. 46 Tools To Make Infographics In The Classroom. Infographics are interesting–a mash of (hopefully) easily-consumed visuals (so, symbols, shapes, and images) and added relevant character-based data (so, numbers, words, and brief sentences).
The learning application for them is clear, with many academic standards–including the Common Core standards–requiring teachers to use a variety of media forms, charts, and other data for both information reading as well as general fluency. It’s curious they haven’t really “caught on” in schools considering how well they bridge both the old-form textbook habit of cramming tons of information into a small space, while also neatly overlapping with the dynamic and digital world.
So if you want to try to make infographics–or better yet have students make them–where do you start? Vizualize.me: Visualize your resume in one click. Dipity - Find, Create, and Embed Interactive Timelines. Piktochart Infographics.