
SSIS: Exporting SQL Server Data to Excel. SQL Server - Como Obtener solo Fecha sin hr:mm:ss. CREATE AVAILABILITY GROUP (Transact-SQL) Updated: March 1, 2017 Creates a new availability group, if the instance of SQL Server is enabled for the Always On Availability Groups feature.
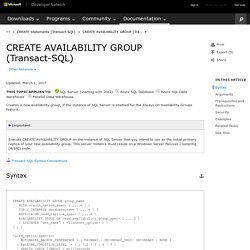
Transact-SQL Syntax Conventions group_name Specifies the name of the new availability group. group_name must be a valid SQL Serveridentifier, and it must be unique across all availability groups in the WSFC cluster. The maximum length for an availability group name is 128 characters. AUTOMATED_BACKUP_PREFERENCE = { PRIMARY | SECONDARY_ONLY| SECONDARY | NONE } Specifies a preference about how a backup job should evaluate the primary replica when choosing where to perform backups. The supported values are as follows: PRIMARY Specifies that the backups should always occur on the primary replica.
SECONDARY_ONLY Specifies that backups should never be performed on the primary replica. SECONDARY Specifies that backups should occur on a secondary replica except when the primary replica is the only replica online. The DATABASE clause is optional. A. How to rebuild System Databases on SQL server 2008 in cluster failover – Microsoft SQL Server. When the master, model, msdb, and tempdb system databases are rebuilt, the databases are dropped and re-created in their original location.
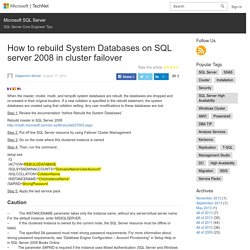
If a new collation is specified in the rebuild statement, the system databases are created using that collation setting. Any user modifications to these databases are lost. Step 1: Review the documentation “before Rebuild the System Databases” Changing SQL Server Collation After Installation. SQL Server installation failed. Error result: -1035451685 Result facility code: 584 Result error code: 17115. Thank you, the log from that point is (truncated):
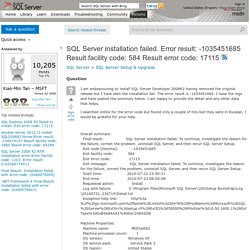
Server - sqlcmd not available after installing mssql-tools - Ask Ubuntu. How To Install Microsoft SQL Server on Ubuntu Linux in 5 Minutes - DotNet Blog. I must admit I was surprised when I learned that Microsoft SQL Server would be availble in Linux.
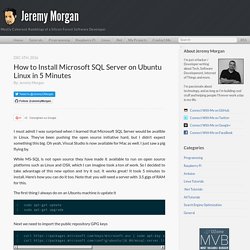
They’ve been pushing the open source initiative hard, but I didn’t expect something this big. Oh yeah, Visual Studio is now available for Mac as well. I just saw a pig flying by. While MS-SQL is not open source they have made it available to run on open source platforms such as Linux and OSX, which I can imagine took a ton of work. So I decided to take advantage of this new option and try it out.
The first thing I always do on an Ubuntu machine is update it Next we need to import the public repository GPG keys. Microsoft Learning. Microsoft Virtual Academy – Free Online Training for Developers, IT Professionals and Data Scientists. Internal SQL Server Diagnostics Tools, Part 1: PSSDiag. Ken Henderson December 7, 2004 Summary: Ken Henderson explains how to use PSSDiag, a diagnostics collection tool for SQL Server.
PSSDiag is one of several Microsoft Product Support Services tools recently released to the Web that are now available for personal use. (26 printed pages) Introduction In the next few columns, I will cover some tools that Microsoft Product Support Services uses to troubleshoot and solve complex SQL Server-related problems. PSSDIAG data collection utility. PSSDIAG supports several optional command-line parameters.
For more information about the optional command-line parameters, see the "PSSDIAG Command Line Parameters" section. However, generally it is not necessary to use the optional parameters. After you have extracted the PSSDIAG files from the package on the Microsoft Download Center, run Pssdiag.exe to start the data collection. When PSSDIAG starts, it first opens, and then configures the log files it has been configured to capture. This process may take several seconds. 2003/10/02 12:30:14.90 PSSDIAG Collection started. If you are running PSSDIAG to collect data about a problem that you can reproduce at will, wait until you receive the message before you try to reproduce the problem. PSSDiag / SQL Diag Manager–How to install, configure and collect performance data from SQL Server 2005/2008/2008 R2 ?–Part 1. PssDiag / SQL Diag Manager is a freely available graphical tool in CodePlex ( It provides easy way to configure what data needs to be collected from SQL Server and Windows Server for troubleshooting SQL Server performance issues.
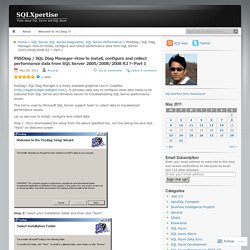
This tool is used by Microsoft SQL Server support team to collect data to troubleshoot performance issues. Let us see how to install, configure and collect data Step 1: Once downloaded the setup from the above specified link, run the Setup.exe and click “Next” on Welcome screen Step 2: Select your installation folder and then click “Next” Step 3: Click “Next” to confirm the installation. Tamaño tablas sql server. Detailed overview of PSSDiag. What is PSSDiag?
PSSDIAG is a general purpose diagnostic collection utility that Microsoft Product Support Services uses to collect various logs and data files. PSSDIAG can natively collect Performance Monitor logs, SQL Profiler traces, SQL Server blocking script output, Windows Event Logs, and SQLDIAG output. More info at How to run PSSDiag? Once you have fot PSSDiag.exe from Microsoft you may have to perform below steps to run PSSDiag. 1. You service will be started when you get prompt like below (mosty in bold green color):2013/02/02 11:10:12.80 PSSDIAG Collection started. 5. NOTE: If for some reason you are not able to access cmd or session is lost and you have to stop the PSSDIiag then just go to Output folder and create sqldiag.stop file from OS and PSSDiag will stop.
Now, the above step will work fine if you want to run pssdiag for small time frame. How to create PSSDIag as service? Tools Tips and Tricks #9: PSSDIAG Configuration Manager. I had been waiting for Diag Manager to be made public so that this post could go online.
Diag Manager is a configuration tool that is used by CSS Engineers to configure a consolidated data collection for Windows Perfmon counters and SQL Server profiler trace (server-side). Additionally, the tool lets you add pre-configured custom diagnostics for Analysis Services configuration data, Mirroring configuration, Event log collection etc. and even custom data collection (using .sql scripts/custom utilities) which can be added using the Custom Diagnostics-> _MyCollectors option. (UI Screenshot below) The tip that I want to talk about with this tool is that .CAB file generated uses a PSSDIAG.XML configuration file when using SQLDIAG to collect data.
If you need to collect data from multiple different instances using the same configuration file, then you can just use the same extracted .CAB file contents with small tweaks to the SQLDIAG.XML file. Blog post talking about the release: Analysis content from SQL Server Pro. In the early days of SQL Server, the Microsoft Product Support Services (PSS) team created a tool to give them the information they needed for troubleshooting during support calls.
The PSSDiag tool, which is supported in SQL Server 2000 versions before Service Pack 3 (SP3), was so popular that it was released to customers for personal use. Microsoft now ships it as SQLdiag, a native tool in the SQL Server 2005 toolkit. SQLdiag is a general-purpose diagnostics-collection utility that you can run as a console application or as a service. SQLdiag collects logs and other data, and it's a good idea to know how to use the tool for no other reason than you're likely to be asked to use it to expedite and simplify diagnostic information gathering when you put in a support call to Microsoft Customer Support Services (CSS).
Functionality. SQL Server: Optimizing SQL Server Query Performance. How-to install, configure and use Full Text Search - OutSystems. “Full-Text Search in SQL Server lets users and applications run full-text queries against character-based data in SQL Server tables. Before you can run full-text queries on a table, the database administrator must create a full-text index on the table. The full-text index includes one or more character-based columns in the table. These columns can have any of the following data types:char, varchar, nchar, nvarchar, text, ntext, image, xml, or varbinary(max) and FILESTREAM.Full-text queries can include simple words and phrases or multiple forms of a word or phrase. A full-text query returns any documents that contain at least one match (also known as a hit). A match occurs when a target document contains all the terms specified in the full-text query, and meets any other search conditions, such as the distance between the matching terms.”Full-Text Query Architecture.
Determinar las consultas que mantienen bloqueos. A menudo, los administradores de bases de datos necesitan identificar el origen de bloqueos que reducen el rendimiento de la base de datos. Por ejemplo: está sospechando que el bajo rendimiento del servidor puede ser debido a los bloqueos. Sp_lock (Transact-SQL) Genera información acerca de los bloqueos. Como copiar una tabla de una BD a otra BD - SQL SERVER - Stack Overflow en español. Como copiar una tabla de una BD a otra BD - SQL SERVER - Stack Overflow en español. Are you using SQL’s Missing Index DMVs? – Bart Duncan's SQL Weblog. Did you know that your SQL Server is keeping track of the indexes that it thinks you should create? The “missing index” DMVs in SQL are a really great new feature in SQL Server 2005 that (in my opinion) seem to have been underutilized so far. If you want to see if this feature can spare you the tedium of an afternoon identifying poor performing queries and tuning them, all you have to do is ask: You’ll want to run this after your server has been up and running a normal workload for a while.
If this returns no results, that’s good news and indicates that you’re not missing any indexes that are obvious enough for the DMV to detect. If it does return some suggestions, even better: you just improved your server’s perf with almost no work. While to me this feature is so cool it almost seems magical, it does have a few limitations you should be aware of: It’s not as smart as the Database Engine Tuning Advisor. Traductor de Google. Database-Level Roles. Sql server - Max number of user connections. The maximum number of connections across SQL Server versions and editions is 32,767. You can determine how many connections SQL Server currently has by looking at: SELECT ConnectionStatus = CASE WHEN dec.most_recent_sql_handle = 0x0 THEN 'Unused' ELSE 'Used' END , CASE WHEN des.status = 'Sleeping' THEN 'sleeping' ELSE 'Not Sleeping' END , ConnectionCount = COUNT(1)FROM sys.dm_exec_connections dec INNER JOIN sys.dm_exec_sessions des ON dec.session_id = des.session_id GROUP BY CASE WHEN des.status = 'Sleeping' THEN 'sleeping' ELSE 'Not Sleeping' END , CASE WHEN dec.most_recent_sql_handle = 0x0 THEN 'Unused' ELSE 'Used' END; If the ratio between used and unused connections from the above query is concerning, it is likely that connection pooling is enabled by client applications connected to the server, and those connections are not being efficiently used.
It is possible to linearly scale the number of connections beyond 32,767 by sharding the data across multiple SQL Server nodes. Niveles de gravedad de error del motor de base de datos. SQL Server Profiler: Cómo capturar consultas SQL y el detalle de su plan de ejecución. Casi siempre nos enteramos de que alguna query va lenta por alguna queja de usuario. Ahora se queja que hace tiempo aquella cosa que hacía tardaba tanto y hoy cuando lo ha hecho un par de veces la cosa ha sido más lenta de normal. Realmente puede estar pasando de todo, pero entre las causas comunes podemos encontrarnos de todo un poco: fragmentación en la misma tabla, estadísticas que no están al dia, carga fuera de lo habitual en el servidor en ese mismo momento, incremento del volumen en las tablas implicadas, cambios en la aplicación...
Focalizándonos solo en problemas relacionados exclusivamente con la base de datos y si el origen de la queja nos lleva a un informe, nuestro trabajo será mas fácil. Siempre partimos de una query concreta que seguramente podemos extraer rápidamente y lanzarla nosotros desde Management Studio para reproducir el caso. En cambio, si el problema de lentitud lo tenemos en una operativa de una aplicación como puede ser el ERP empresarial. SQL Server Wait Statistics: Tell me where it hurts - Paul Randal. Niveles de gravedad de error del motor de base de datos.