
UNITY Mobile. Crear aplicaciones móviles. Create HTML5 Interactive Presentations, Animations, infographics & banners - HTML5 Presenter by Easy WebContent. Free Mobile Website Design. Easy Android App Creator. Digital Publishing and Page Turn Software.
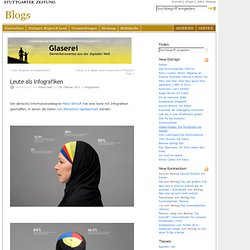
Leute als Infografiken bei Glaserei. Der dänische Informationsdesigner Peter Ørntoft hat eine Serie mit Infografiken geschaffen, in denen die Daten von Menschen repräsentiert werden: (Gefunden bei laughingsquid)
World Economic Forum-IdeasLab. Visualización.