
See, understand, and share numbers. 9 Ways to Visualize Proportions – A Guide. With all the visualization options out there, it can be hard to figure out what graph or chart suits your data best.
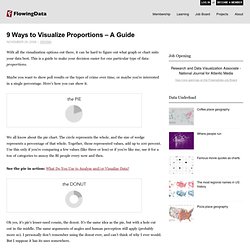
This is a guide to make your decision easier for one particular type of data: proportions. Maybe you want to show poll results or the types of crime over time, or maybe you're interested in a single percentage. Here's how you can show it. We all know about the pie chart. The circle represents the whole, and the size of wedge represents a percentage of that whole.