
MARC - Mid-America Regional Council - Regional Planning for Greater Kansas City. MARC staff maintain many GIS datasets describing boundaries, resources, and features in the Kansas City Region.
The MARC GIS program provides data for public access in order to increase regional awareness on shared issues, to provide a public service, and to assist local governments and planning agencies with their own maps, analyses and decision-making processes. Many datasets cover the 9-county region, which includes Johnson, Leavenworth, Miami and Wyandotte Counties in Kansas, and Cass, Clay, Jackson, Platte and Ray Counties in Missouri. Exceptions are noted below. MARC makes no representations or warranties regarding the accuracy of data or maps. MARC shall not be liable under any circumstances for any direct, special, incidental or consequential damages with respect to any claim by any user or third party on account of or arising from the use of data or maps. MARC provides custom mapping and data services for $75 per hour. MARC - Mid-America Regional Council - Regional Planning for Greater Kansas City.
National Ambient Air Quality Standards - DNR. National Ambient Air Quality Standards The air quality of outdoor air breathed by the public is determined by carefully comparing the monitored level of air pollutants with air quality standards established by the EPA.
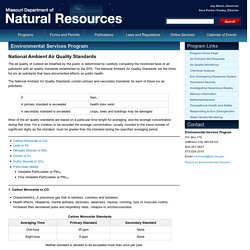
The National Ambient Air Quality Standards set the limits for six air pollutants that have documented effects on public health. The National Ambient Air Quality Standards contain primary and secondary standards for each of these six air pollutants. Most of the air quality standards are based on a particular time length for averaging, and the average concentration during that time.
For a violation to be recorded the average concentration, usually rounded to the same number of significant digits as the standard, must be greater than the standard during the specified averaging period. 1. Characteristics: A poisonous gas that is odorless, colorless and tasteless. Neither standard is allowed to be exceeded more than once per year.
Back to top 2. Environmental Services - DNR. Complete Current Missouri Air Pollution Data This is raw data.
It has not been validated and may contain errors. The data is obtained from automated, continuous instruments; no human has reviewed or checked the accuracy of this data. The data has been subject to only preliminary automated quality assurance procedures. Special conditions such as power outages and equipment malfunction can produce data that is invalid. Capstone Project #1. Kansas Bigger Cities (over 6000 residents) - Real Estate, Housing, Schools, Residents, Crime, Pollution, Demographics and More. Clearinghouse for Emission Inventories and Emissions Factors. Additional Summary Data Tribal Lands Emissions Summaries Sector (Includes both criteria and hazardous air pollutants) (XLS, 647 KB) Tier 1 (Includes criteria pollutants only) (XLS, 87 KB) Facility Emissions Summaries Facility-level by Pollutant: Facility-level summary (zipped CSV, 110.0 MB) All Sector: National - county aggregated - sector file (zipped MDB, 33.7 MB) Biogenics: Various levels of aggregation down to monthly county emissions (zipped XLS, 14.3 MB) Tier Summaries: National/State/County summaries for Tier 1, Tier 2 and Tier 3 2008 version 3 Pb facility-process: Point source facility-process summary for lead (Pb) (zipped CSV, 3.11 MB) 2008 version 3 Hg: Point source facility-process, nonpoint, onroad, nonroad and national summary for mercury (Hg)(zipped ACCB, XLSX and PDF, 34.7 MB) Maps and Fusion Tables.
Kansas Environmental Public Health Tracking. Air Quality for Kansas. E3 Fleet - Emissions Calculator. Welcome to the Emissions Calculator.
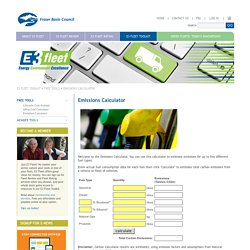
You can use this calculator to estimate emissions for up to five different fuel types. Enter actual fuel consumption data for each fuel then click "Calculate" to estimate total carbon emissions from a vehicle or fleet of vehicles. Notes on the Emissions Calculator Biodiesel and ethanol (* above): For % biodiesel or ethanol, enter the percentage biofuel blend. For example, if you used 1000 litres of B20, you would enter 20% biodiesel, 1000 litres. Lifecycle Emissions Calculation: Lifecycle emissions are entire fuel cycle, but do not include vehicle assembly and materials.
Disclaimer: These calculator results are estimates, using emission factors and assumptions from Natural Resources Canada’s GHGenius v3.14 model. Search & Browse. Current Winds in. Johnson County QuickFacts from the US Census Bureau. Demographics. 2010_Profile_Map_Kansas.pdf. Elementary / Elementary Schools. Kansas City Elementary Schools - Find a School in Kansas City, Missouri - SchoolDigger.com.