
Why Do We Pay Pure Mathematicians? Or, the Many Uses of Uselessness One of the joys of being married to a pure mathematician—other than finding coffee-stained notebooks full of integrals lying around the flat—is hearing her try to explain her job to other people.
“Are there…uh… a lot of computers involved?” “Do you write equations? I mean, you know, long ones?” “Do you work with really big numbers?” No, sometimes, and no. Still, she doesn’t begrudge the questions. So, here’s this teacher’s feeble attempt to explain the profession, on behalf of all the pure mathematicians out there. Q: So, what is pure math? A: Picture mathematics as a big yin-yang symbol. Applied mathematicians focus on the real-world uses of mathematics. Pure mathematics, by contrast, is mathematics for its own sake. Q: So if “applied” means “useful,” doesn’t it follow that “pure” must mean…
5 Business & Design Tools Every Tech Freelancer Should Learn - ReadWrite. Guest author Danny Groner is manager of blogger partnerships and outreach for Skillfeed.
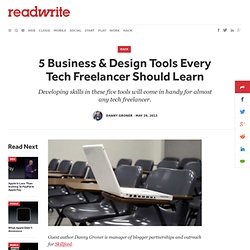
When you work as a freelance designer or coder, your success or failure is entirely reliant on you. Since there's no one else you can blame for missed deadlines or shoddy work, it's incumbent on you to keep your skills fresh, your attention fixed and your ideas polished. The people who excel working for themselves are more than just good networkers - they make themselves marketable through the array of tasks they can tackle and complete.
Quite simply, they offer more opportunity and flexibility than their peers. It's always going to be easier and more efficient for a company to hire one contractor for a given project than two, or more. (See also 15 Programming Skills Most Coveted By Employers.) Developing skills in these five tools - four from Adobe, one from Microsoft - will come in handy for almost any tech freelancer: 5 Tools For Creating Your Own Infographics - ReadWrite. Five years ago, almost nobody knew what the heck an infographic was.
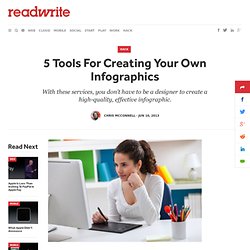
(I sure didn’t, and I was a graphic design major in college at the time.) Now that the infographic craze has saturated us with new visual knowledge (and marketing gimmicks), something interesting has happened: The creation of infographics has become democratized. No longer is the act of creating a visual data story confined to professional designers using professional tools like Adobe Illustrator or Photoshop. Now anyone with a data set can build an infographic. (See also 5 Business & Design Tools Every Tech Freelancer Should Learn.)
Create infographics & online charts. Www.nus.edu.sg/celc/research/books/cwtuc/chapter04.pdf. Create amazing maps with your data — CartoDB. Step 5: Writing And Presenting Your Findings - Jack, Joseph and Morton Mandel School of Applied Social SciencesJack, Joseph and Morton Mandel School of Applied Social Sciences. Tips on effective use of tables and figures in research papers. Several studies, journal guidelines, and discourses on scientific writing1-10 affirm the critical role that tables, figures, and graphs (or display items) play in enhancing the quality of manuscripts.
At the manuscript screening stage, these display items offer reviewers and journal editors a quick overview of the study findings, and once the paper is published, they do the same for readers (some of whom look only at these display items and not at the rest of the manuscript7). Planning your paper: When to use tables and figures in scientific papers Producing effective tables and figures requires careful planning that begins at the manuscript writing stage itself. Here’s how to go about it: First, check out what your target journal has to say on the issue.
Table 1: How to choose between tables, figures, and text to present data Best practices for presentation of tables and figures in scientific papers General guidelines: Make your Findings Effective: Choosing the Right Method to Present Research. As user researchers we have a common goal: to provide a crystal clear picture of our research.
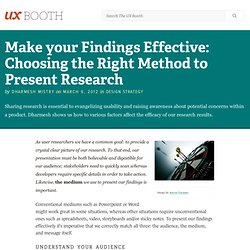
To that end, our presentation must be both believable and digestible for our audience; stakeholders need to quickly scan whereas developers require specific details in order to take action. Likewise, the medium we use to present our findings is important. Conventional mediums such as Powerpoint or Word might work great in some situations, whereas other situations require unconventional ones such as spreadsheets, video, storyboards and/or sticky notes.
To present our findings effectively it’s imperative that we correctly match all three: the audience, the medium, and message itself. Understand your audience. Www.nus.edu.sg/celc/research/books/cwtuc/chapter04.pdf. Www.curtin.edu.my/tl2011/download/papers/nonrefereed/Enhancing Learning Teaching & Learning Conference 2011.pdf. Vol 3 No 1. Teachers' Beliefs and Teaching Beliefs. Share HomeJournal ContentsIssue ContentsVolume 3 Number 1©The Author(s) 2001 Teachers' Beliefs and Teaching Beliefs James Raths University of Delaware On the premise that teacher education programs, with their emphasis on methods, are largely ineffective in improving current teaching practice, this paper examines ways teacher educators can change some of the beliefs of teachers and teacher candidates early in a program so as to optimize the impact of learning new teaching practices.
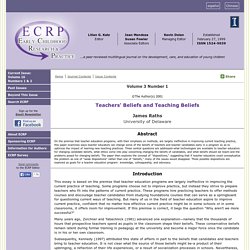
Three central questions are addressed-what technologies are available to teacher educators for changing candidate beliefs, what ethics come into play concerning changing the beliefs of candidates, and what beliefs should we teach-and the problems posed for changing beliefs. Sam2013-dla.pdf. 2.4.1.Background.reading. The post method era.