
Mind the Map: Toward a Handbook for Journalists. “What is it we want our maps to be now, if no longer a single authoritative view or the world?”

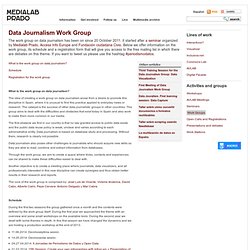
- Brooke Gladstone, Host of NPR’s On the Media Maps are rhetorical devices. Propositions. Arguments. Stories. They present the world according to how the mapmaker sees it. Why to Beware of the Map Maps present facts?? Reuter's "See Inequality Grow" Feature Symbol Map (source) How to Employ a Map 1. In "Narrative Visualization: Telling Stories with Data" (Segel & Heer, 2010), the authors point to further strong points of this visualization: One visual platform is consistently used for each map, and the overall color scheme changes for each tab, which allows the reader to switch between maps and easily see which variables are changing. HorizonteFBT: Periodismo de datos. Periodismo de datos - Grupo de trabajo. What is the work group on data journalism?
Schedule Registration for the work group What is the work group on data journalism? The idea of creating a work group on data journalism arose from a desire to promote this discipline in Spain, where it is unusual to find this practice applied to everyday news or research. Journalism in the Age of Data: A Video Report on Data Visualization by Geoff McGhee.
Peter Aldhous, science journalist. Journalism and Media Studies Center at the University of Hong Kong, Spring 2013. For this assignment you will evaluate the performance of OpenCalais, a commercial entity extraction service.
You’ll do this by building a text enrichment program, which takes plain text and outputs HTML with links to the detected entities. Then you will take five random articles from your data set, enrich them, and manually count how many entities OpenCalais missed or got wrong. 1. Get an OpenCalais API key, from this page. 2. 3. Each instance has “offset” and “length” fields that indicate where in the input text the entity was referenced. 4. In many cases, like the example in step 3, OpenCalais will not be able to give you any information other than the string corresponding to the entity, result.entities[x]['name'].
In other cases, especially companies and places, OpenCalias will supply a link to an RDF document that contains more information about the entity. In this case the resolutions array will contain a hyperlink for each resolved entity, and this is where your link should go. 5. Escuela De Datos - evidencia es poder. Free Online Data Training. Data visualization basic training; from spreadsheet to data mapping. kdmcBerkeley is offering four free online training courses in data journalism.
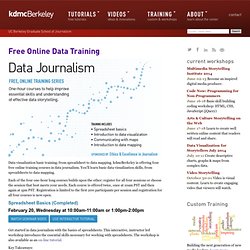
You'll learn basic data visualization skills, from spreadsheets to data mapping. Each of the four one-hour long courses builds upon the other; register for all four sessions or choose the session that best meets your needs. Each course is offered twice, once at 10am PST and then again at 1pm PST. Registration is limited to the first 200 participants per session and registration for all four courses is now open. Spreadsheet Basics (Completed) February 20, Wednesday at 10:00am-11:00am or 1:00pm-2:00pm Get started in data journalism with the basics of spreadsheets. Key Takeaways: Knowledge of and working with the main components of a spreadsheet: cells, rows, columns How to enter data into a spreadsheetUse of formulas to perform simple mathematical calculations Working with functions in large datasets. The ProPublica Nerd Blog. We used WebGL to create the 3-D map of FEMA's new flood zones.
Earlier this year we published a story and an interactive graphic about the evolving Federal Emergency Management Agency flood maps in New York City in the year after Hurricane Sandy. FEMA had advisory maps in the works when Sandy hit. The agency rushed them out in the days afterward as a first sketch for those looking to rebuild. Our story found that while the maps continued to be revised over the course of a year, homeowners had little guidance on how much their home’s value — as well as its required elevation — were changing as they struggled to rebuild after the storm.
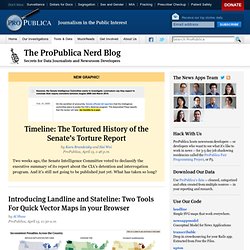
To complicate matters, Congress had recently passed legislation which threatened to dramatically raise flood insurance premiums for those remapped into high-risk flood zones. Welcome - Manual de Periodismo de Datos. Scraping for Journalism: A Guide for Collecting Data. Photo by Dan Nguyen/ProPublica Our Dollars for Docs news application lets readers search pharmaceutical company payments to doctors.
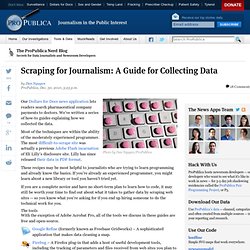
We’ve written a series of how-to guides explaining how we collected the data. Most of the techniques are within the ability of the moderately experienced programmer. The most difficult-to-scrape site was actually a previous Adobe Flash incarnation of Eli Lilly’s disclosure site. Lilly has since released their data in PDF format. These recipes may be most helpful to journalists who are trying to learn programming and already know the basics. Data VisualizationTutorials. KDMC produces a wealth of digital media tutorials to support our training sessions and classes.
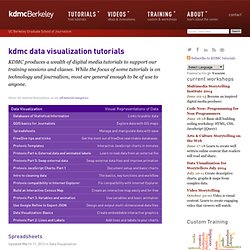
While the focus of some tutorials is on technology and journalism, most are general enough to be of use to anyone. Spreadsheets Updated March 11, 2012 in Data Visualization This tutorial covers the basics of creating and doing calculations with a spreadsheet. It is based on using Google Docs spreadsheets, with notes on some differences with Excel spreadsheets. Protovis Part 4: External data and animated labels. Knight Center for Journalism in the Americas. Data Driven Journalism.