
Randy Olson sur Twitter : "The remarkable distances you can travel on a European train in less than a day: #dataviz. Map: The remarkable distances you can travel on a European train in less than a day. Tourists visiting Europe are often advised to travel by train rather than plane or car.
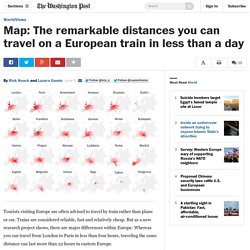
Trains are considered reliable, fast and relatively cheap. But as a new research project shows, there are major differences within Europe: Whereas you can travel from London to Paris in less than four hours, traveling the same distance can last more than 22 hours in eastern Europe. Peter Kerpedjiev, a PhD student at the University of Vienna in Austria, gathered data that offers stunning insights into Europe's railway network. He selected 28 European cities and illustrated which surrounding cities or areas could be reached within a certain time. The following maps illustrate the most striking conclusions that can be drawn from Kerpedjiev's data. If you prefer fast rides, start somewhere close to Paris or London Europe's fastest train network is located in the west of the continent. “I was really surprised how well connected Paris is.
Eastern Europe is incredibly poorly connected. Profil de la rue des Pyrénées. Disinformation Visualization: How to lie with datavis. By Mushon Zer-Aviv, January 31, 2014 Seeing is believing.
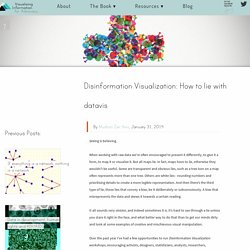
When working with raw data we’re often encouraged to present it differently, to give it a form, to map it or visualize it. But all maps lie. In fact, maps have to lie, otherwise they wouldn't be useful. Some are transparent and obvious lies, such as a tree icon on a map often represents more than one tree. It all sounds very sinister, and indeed sometimes it is. Over the past year I’ve had a few opportunities to run Disinformation Visualization workshops, encouraging activists, designers, statisticians, analysts, researchers, technologists and artists to visualize lies.
Centuries before big data, computer graphics and social media collided and gave us the datavis explosion, visualization was mostly a scientific tool for inquiry and documentation. Visualizing MBTA Data. TIME : front page data. Why We Hate Infographics (And Why You Should) Those 2 guys invented the spreadsheet with Visicalc.
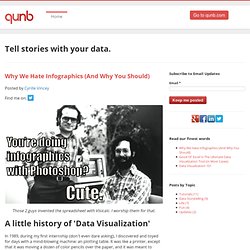
I worship them for that. In 1989, during my first internship (don't even dare asking), I discovered and toyed for days with a mind-blowing machine: an plotting table. It was like a printer, except that it was moving a dozen of color pencils over the paper, and it was meant to draw... graphs, as it was called in the 80's.
Then in the early 90's, hipsters of that time decided that graphs weren't cool enough, and called them charts. On an unrelated note, charts started being printed on regular printers, and boredom killed millions of interns. Then in the mid-00's, the art of plotting/graphing/charting data was re-named... data visualization. Reshaping New York - Interactive Feature. Loading Celebrating the Waterfront New buildings constructed during Mr.
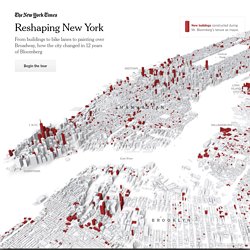
Bloomberg's tenure as mayor. Celebrating the Waterfront Mr. Brooklyn Bridge Park, 2006 Photo: Alex S. Brooklyn Bridge Park, 2013 Photo: Richard Perry/The New York Times. Du jeu de données au jeu avec les données. Vous le savez sûrement, le XXIe siècle est – entre autres – celui de la donnée.
A l’heure des metrics en tous genres (pour la collecte), du numérique (pour le stockage et le maniement) et des réseaux (pour le partage et la diffusion), la data est partout, et prend de plus en plus de place dans nos vies. Les partis politiques et grandes entreprises tentent de prévoir le comportement du citoyen lambda à coup de big data, les institutions et les pouvoirs publics tendent doucement vers plus de transparence avec l’open data, n’importe qui peut en apprendre sur lui-même grâce aux nombreuses applications de quantified self qui inondent le marché… et les journalistes, dans tout ça ? Pour ceux dont le métier est de transmettre l’information et d’expliquer le monde, manipuler des tableaux Excel de milliers de lignes et en tirer la substantifique moelle n’est pas la chose la plus simple qui soit.
Les données visualisées peuvent être des images fixes, bien sûr. Making data visualizations – A survival guide. The Motley Roots of Data Visualization in 19th Century Census Charts - Design. The U.S.
Census has long been a lightning rod for controversy. Does it wildly undercount minorities? Wildly overcount minorities? Or—as Michelle Bachmann warned us—is it a liberal plot orchestrated by ACORN? But no one has ever accused our Census Bureau of being a hotbed of…graphic design. A Handsome Atlas celebrates Uncle Sam’s data chops by reproducing three Statistical Atlases from the latter decades of the 19th century. Soma unearthed the Atlases by chance. Soma organized the 384 plates into eight topics—from manufacturing to mortality—and eight "visualizations" including bar graphs, maps, and pie charts. One plate is so handsome, Soma actually un-digitized it. Of course this stuff isn’t just suitable for framing. Curious footnotes in American history pop up everywhere, as Soma discovered when he spotted an apparent flaw in a U.S. map.
The first Statistical Atlas of the United States of America was published in 1874 to coincide with the nation’s centennial. Graphic presentation. Exploration de données statistiques relatives aux catégories de population par bassin d’emploi avec Scatterdice.