
SC - powerful image rendering. SC is a useful function for displaying rich image data, of use to anyone wishing to visualize and save 2D data in ways beyond that which MATLAB built-in functions allow.
This function can be used in place of IMAGE, IMAGESC and IMSHOW, but does so much more. It is fast and displays images as they should be - correct aspect ratio, integer magnification, no axes. In addition, it can return the image as an output variable - useful for saving to disk, texture mapping surfaces, and post-rendering manipulation such as overlaying/combining two or more images. All the MATLAB built-in colormaps are implemented, but without MATLAB's nasty discretization artifacts. Plus, there are many new colormaps which are helpful for viewing more complex data, such as optic flow, likelihoods over images, difference images, segmentations, stereo image pairs (as anaglyphs) and edge-maps with orientation. SC comes with a complete demo, to help you get the most out of it. Colorbrewer: Color Advice for Maps. Data Graphics Research. Open colormap editor - MATLAB. Syntax Description colormapeditor displays the current figure's colormap as a strip of rectangular cells in the colormap editor.
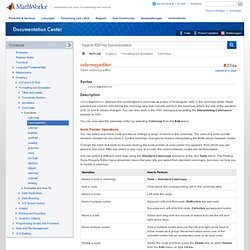
Node pointers are colored cells below the colormap strip that indicate points in the colormap where the rate of the variation of R, G, and B values changes. You can also work in the HSV colorspace by setting the Interpolating Colorspace selector to HSV. You can also start the colormap editor by selecting Colormap from the Edit menu. Node Pointer Operations You can select and move node pointers to change a range of colors in the colormap. Change the color at a node by double-clicking the node pointer. You can select a different color map using the Standard Colormaps submenu of the GUI Tools menu. Current Color Info When you put the mouse over a color cell or node pointer, the colormap editor displays the following information about that colormap element: Interpolating Colorspace Interpolating in HSV. Color Data Min and Max Examples Example Objectives Running the Example. Cbrewer : colorbrewer schemes for Matlab: All Files. Colormap Manipulations. Contents Basic Colormap Manipulation Let's start with a grayscale image from the Image Processing Toolbox and display it using imshow. imshow cameraman.tif and let's take a quick look at the colormap cm = get(1,'colormap'); figure rgbplot(cm) legend(get(gca,'children'),{'blue' 'green' 'red'},'location','NorthWest') or superpose a colorbar on the image plot. figure(1) colorbar SouthOutside It's difficult at first to see much detail about the man's clothing.
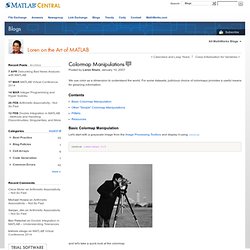
Brighten(.2) Notice the extra detail around the buttons and glove when we brighten the colormap more (at the expense of the lighter background). brighten(.4) Now let's see what the individual channels look like. cm = get(1,'colormap'); figure(2) rgbplot(cm) legend(get(gca,'children'),{'blue' 'green' 'red'},'location','NorthWest') close(2) Other "Simple" Colormap Manipulations Colormaps contain are 3-column matrices with double values lying between 0 and 1.
Colorbar off colormap(1-cm) Get another monotonic colormap and see other colormap choices.