
Data visualization using Illustrator. Introduction This article covers basic techniques for data visualization using Adobe Illustrator.
Illustrator Basics We're not going to cover all basics here. If you're entirely new to Illustrator, please read up in the Illustrator_Basics article. Below is a quick recap of some of the most important tools that you'll use for this article. Selection tools: Illustrator has two selection tools: Selection tool select entire objects to move or transform the object as a whole. Direct selection tool to select components of geometry, such as points or lines. Every object has two properties for color: Fill color fill color of the object. Stroke Color color of the border of an object. Text Use the text tool to add text to your graphics. Besides the regular ways of adding text, Illustrator also has the option to make text follow a line or fit within a drawn shape. Character Type panel in Illustrator Paragraph Type panel in Illustrator Font family Type of font to use for the text.
Font size size of the text. Colors. Amazon. Amazon. Amazon. Amazon. Amazon. 100 Diagrams That Changed the World. Since the dawn of recorded history, we’ve been using visual depictions to map the Earth, order the heavens, make sense of time, dissect the human body, organize the natural world, perform music, and even concretize abstract concepts like consciousness and love. 100 Diagrams That Changed the World (public library) by investigative journalist and documentarian Scott Christianson chronicles the history of our evolving understanding of the world through humanity’s most groundbreaking sketches, illustrations, and drawings, ranging from cave paintings to The Rosetta Stone to Moses Harris’s color wheel to Tim Berners-Lee’s flowchart for a “mesh” information management system, the original blueprint for the world wide web.
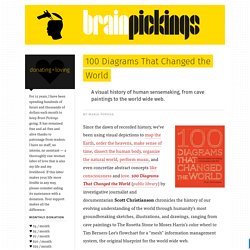
It appears that no great diagram is solely authored by its creator. Most of those described here were the culmination of centuries of accumulated knowledge. Most arose from collaboration (and oftentimes in competition) with others. Free Infographics Design Vector Elements. This is the big list of Vector Elements which are great for infographics designing.
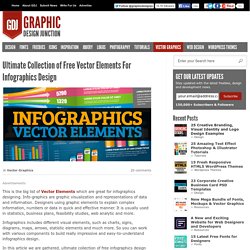
Info-graphics are graphic visualization and representations of data and information. Designers using graphic elements to explain complex information, numbers or data in quick and effective manner. It is usually used in statistics, business plans, feasibility studies, web analytic and more. Infographics includes different visual elements, such as charts, signs, diagrams, maps, arrows, statistic elements and much more. So you can work with various components to build really impressive and easy-to-understand infographics design.
In this article we are gathered, ultimate collection of free infographics design vector elements and vector graphics which will surely help you in your design process. You may be interested in the following modern trends related articles as well. Subscribe to our RSS via email, simply enter your email address & click subscribe. 100+ Infographic Elements (Vector) Download Vector Elements. Infographies on Pinterest. Over 100 Incredible Infographic Tools and Resources (Categorized) This post is #6 in DailyTekk’s famous Top 100 series which explores the best startups, gadgets, apps, websites and services in a given category.

Total items listed: 112. Time to compile: 8+ hours. Follow @DailyTekk on Twitter to make sure you don’t miss a week! Update: Be sure to check out our latest post on infographics: Infographics Are Everywhere – Here’s How to Make Yours Go Viral. Infographics. Interactive Infographic with SVG and CSS Animations.
Learn how to build an interactive animated infographic using SVG, CSS and JavaScript.
View demo Download source One of the less talked about features of newer browsers is increasing support for the SVG file format. If you are unfamiliar with SVG, it stands for Scalable Vector Graphics. Unlike raster image formats like PNG, JPG or GIF, the vector graphics contained within SVG files are completely scalable to any size and will display at any resolution or screen density without quality loss.
In many cases, SVG files will also be much smaller in filesize and download quicker. But one of the really cool things that some developers do not realize is that SVG is built on the XML specification, which at the end of the day means that its plain old markup, and can be worked with in a similar manner to HTML. With the right techniques and modern browser support, developers can now produce some pretty impressive animations, effects and interactions using SVG.
Preparing an SVG file The HTML The CSS. Visme - Create Interactive Online Presentations, infographics, animations & banners in HTML5. 10 Steps To Designing An Amazing Infographic. Information can be useful—and even beautiful—but only when it’s presented well.
In an age of information overload, any guidance through the clutter comes as a welcome relief. That’s one reason for the recent popularity of information graphics. Infographics are visual designs that help to explain complicated data in a simple way (mental-health emergencies at Burning Man, anyone?). But how are they created? What can we learn from the designer’s process? Over the last decade, Hyperakt has come to specialize in this type of design, and we’ve found a process that works for us.