
Learn to Code for Data Analysis - Free online course. The course does not assume prior experience in programming or data analysis.
Basic familiarity with a spreadsheet application will be an advantage. The course does not require any knowledge of statistics, but you need to have basic numeracy skills, like writing arithmetic expressions, using percentages and understanding scientific notation. If you wish to brush up on your numeracy skills, we recommend the FutureLearn course Basic Science: Understanding Numbers from The Open University. To study this course you will use specialist software. You can use the software online, via a free account on a website, or offline, by downloading and installing a free software package. The offline software has no limitations and is the recommended option.
Whether you choose the online or offline software option, you will need to be proficient in basic computer tasks, like creating folders, downloading files and copying them to specific folders, etc. Design, Teaching and Learning. An Open Lab-Notebook Experiment. Introduction to D3. Data Visualization and D3.js Course. Lesson 1a Visualization Fundamentals (2 hours) Learn about the elements of great data visualization.
In this lesson, you will meet data visualization experts, learn about data visualization in the context of data science, and learn how to represent data values in visual form. Lesson 1b D3 Building Blocks (4 hours) Learn how to use the open standards of the web to create graphical elements. You’ll learn how to select elements on the page, add SVG elements, and how to style SVG elements. Mini-Project 1: RAW Visualization (2 hours) Create a data visualization using a software of your choice. Lesson 2a Design Principles (2 hours) Which chart type should I use for my data? Lesson 2b Dimple.js (4 hours) Learn how to create graphics using the Dimple JavaScript library. Data Visualization and Infographics with D3.js - Knight Center JournalismCourses.org. Data Visualization and Infographics with D3.js Time: August 17 to September 27, 2015 Instructors: Alberto Cairo and Scott Murray Welcome to “Data Visualization and Infographics with D3,” a six-week online course with professors Alberto Cairo and Scott Murray!
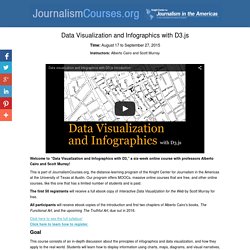
This is part of JournalismCourses.org, the distance-learning program of the Knight Center for Journalism in the Americas at the University of Texas at Austin. Our program offers MOOCs, massive online courses that are free, and other online courses, like this one that has a limited number of students and is paid. The first 50 registrants will receive a full ebook copy of Interactive Data Visualization for the Web by Scott Murray for free. All participants will receive ebook copies of the introduction and first two chapters of Alberto Cairo's books, The Functional Art, and the upcoming The Truthful Art, due out in 2016. Click here to see the full syllabus! Goal Objectives At the end of the course, you will come away with knowledge about: Quora. Search - data visualization - Quora. UC Berkeley Video and Podcasts for Courses & Events.
VideoLectures.NET - VideoLectures.NET. Online Courses and Nanodegree Programs to Advance Your Career - Udacity. JavaScript Courses on Treehouse. Coursera. Data Visualization - University of Illinois at Urbana-Champaign. Learn to code. Create and share visual ideas online. Piktochart: Infographic and Presentation Tool for Non-Designers. Weave (Web-based Analysis and Visualization Environment) VisualEyes. Explore, create, share. Perspective. ChartsBin.com - Visualize your data. Weave (Web-based Analysis and Visualization Environment) DataHero: Unmask the Answers in Your Data. Drive.
Plot.ly. Datawrapper. Online Charts Builder. Hohli Online Charts Builder New version: Try new version of Charts Builder, it based on new Google Charts API Load From Image URL: Chart Data can't equal to original, but very similar to it.

Only for images on chart.apis.google.com Chart Type: 3D Pie charts Lines Bar charts Pie charts For Pie Charts with labels choose 1000x300 or 800x375 size Venn diagrams Scatter plots Radar charts Chart Size: 320x240 Horizontal 1000x300 800x375 600x500 320x240 Vertical 300x1000 375x800 500x600 240x320 Square 546x546 400x400 300x300 200x200. Silk - Organize your knowledge with overviews and visualizations. Many Eyes. Data Journalism, Spring 2014. Overview This course teaches some of the skills and techniques necessary for obtaining, analyzing and communicating structured information effectively.
Students will scrutinize techniques used in previously published projects and will also analyze data on their own, primarily using Excel, HTML, CSS and Javascript (and JS libraries like D3), and, in some cases, command-line tools. Most classes will begin with a short lecture and discussion about a topic, technique or published piece of journalism that used data journalism. This will be a technical course, but the primary goal of the course is journalistic; we hope not to get too bogged down in the fiddly bits of the latest technologies. We'll try to demystify the technological side of things so you feel comfortable getting started and thinking programmatically. Your Professors Kevin Quealy — Bald, Minnesotan, talks too much. Amanda Cox — Sometimes known as the Godfather.
Shadow Professor.