
Visual ANOVA. Visual ANOVA Instructions Copyright 1998, 2000 Tom Malloy Note: These instructions are abstracted from and can be supplemented by the full web lecture on the one-way ANOVA for independent groups available through another link on this page.
PRINT: You may print this web page on your local printer if you wish. Visual ANOVA is a simple little program that lets you put all this theory we've been describing into a simple visual whole. It assumes that you've read the Meanings and Intuitions section and have have understood the the general ideas at least. Right below the "Understanding ANOVA Visually" title are three little buttons labeled MS between, MSwithin, and Instructions. The tool interface is a graph representing a four group study. Anova in Excel - Easy Excel Tutorial. This example teaches you how to perform a single factor ANOVA (analysis of variance) in Excel.
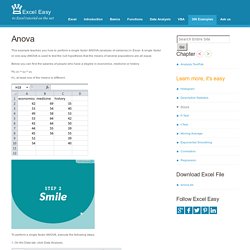
A single factor or one-way ANOVA is used to test the null hypothesis that the means of several populations are all equal. Below you can find the salaries of people who have a degree in economics, medicine or history. H0: μ1 = μ2 = μ3 H1: at least one of the means is different. To perform a single factor ANOVA, execute the following steps. 1. Note: can't find the Data Analysis button? 2. 3. 4. ANOVA with Excel. How To Calculate and Understand Analysis of Variance (ANOVA) F Test. One-Way ANOVA. 7.4.3.4. 1-Way ANOVA calculations. Methods Manual: t-test, hand calculation. Measures of Effect Size (Strength of Association) - Effect Size Calculators. P value calculator. Using ANOVA to Find Differences in Population Means. Chew Jian Chieh February 26, 2010 Three methods used to dissolve a powder in water are compared by the time (in minutes) it takes until the powder is fully dissolved.
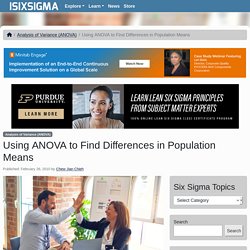
The results are summarized in the following table: It is thought that the population means of the three methods m1, m2 and m3 are not all equal (i.e., at least onem is different from the others). How can this be tested? One way is to use multiple two-sample t-tests and compare Method 1 with Method 2, Method 1 with Method 3 and Method 2 with Method 3 (comparing all the pairs). ONE-WAY ANOVA. Analysis of variance (ANOVA) for comparing means of three or more variables.
Use this test for comparing means of 3 or more samples/treatments, to avoid the error inherent in performing multiple t -tests Background. If we have, say, 3 treatments to compare (A, B, C) then we would need 3 separate t -tests (comparing A with B, A with C, and B with C). If we had seven treatments we would need 21 separate t -tests.
Univariate Statistics - ANOVA Terms. Tell when to use each type of ANOVA, the possible research hypotheses for this statistical model, and when ANOVA can be used to test each type of Research Hypothesis (attributive, associative and causal) Tell when to use each type of ANOVA, the possible research hypotheses for this statistical model, and when ANOVA can be used to test each type of Research Hypothesis (attributive, associative and causal).
A between groups ANOVA should be used when we are comparing one qualitative variable (the IV), and one quantitative variable (the DV), and there are two distinct groups with different participants in each. A within groups ANOVA should be used when each participant is in all of the conditions of the study. The IV and DV remain the same, but in a within groups ANOVA calculation, two DVs will be compared to each other, so two quantitative variables will be assessed. Both types of ANOVA are used to study mean differences between groups. A BG ANOVA research hypothesis for example will be: females will have higher average means on the Automatic Thoughts Questionnaire than will males. Analysis of Variance Designs. Analysis of Variance Designs Author(s) David M.
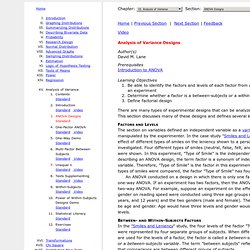
Lane Prerequisites Introduction to ANOVA Learning Objectives Be able to identify the factors and levels of each factor from a description of an experiment Determine whether a factor is a between-subjects or a within-subjects factor Define factorial design There are many types of experimental designs that can be analyzed by ANOVA. Factors and Levels An ANOVA conducted on a design in which there is only one factor is called a one-way ANOVA. Between- and Within-Subjects Factors In the "Smiles and Leniency" study, the four levels of the factor "Type of Smile" were represented by four separate groups of subjects. In the "ADHD Treatment" study, every subject was tested with each of four dosage levels (0, 0.15, 0.30, 0.60 mg/kg) of a drug. Multi-Factor Designs It is common for designs to have more than one factor. Table 1. This design has two factors: age and gender.
Analysis of Variance, Monash U. Analysis of Variance (ANOVA) Purpose The reason for doing an ANOVA is to see if there is any difference between groups on some variable. For example, you might have data on student performance in non-assessed tutorial exercises as well as their final grading. You are interested in seeing if tutorial performance is related to final grade.
ANOVA allows you to break up the group according to the grade and then see if performance is different across these grades. Logic of Anova - good. Between Subjects One Way ANOVA example. Variance. Variance and the Design of Experiments Contents Variance The F Statistic The Analysis of Variance Power and Sensitivity Designing Experiments - Independent Groups Improving Experimental Designs Using Covariates with Independent Groups Designs Correlated Groups Designs Repeated Measures and Order Effects Complete versus Partial Counterbalancing The Bottom Line Variance When you look at the data from an experiment, the first thing you may notice is that the numbers are not all the same, even for the same condition or the same subject.
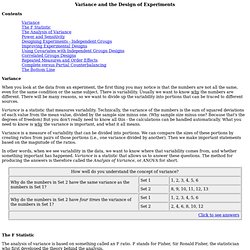
There is variability. Variance is a statistic that measures variability. Variance is a measure of variability that can be divided into portions. In other words, when we see variability in the data, we want to know where that variability comes from, and whether something important has happened. The F Statistic The analysis of variance is based on something called an F ratio.
By the way, the word "error" is a most unfortunate misnomer. ANOVA - Statistics Solutions.