
Manilla puts everything in one place. Stats about all US cities - real estate, relocation info, house prices, home value estimator, recent sales, cost of living, crime, race, income, photos, education, maps, weather, houses, schools, neighborhoods, and more. State and County QuickFacts. Octw.jpg (JPEG Image, 450 × 1200 pixels) Test Your Geography Knowledge- USA.
EPA Unveils Interactive Map Of America's Carbon Polluters. By Brad Johnson on January 11, 2012 at 1:51 pm "EPA Unveils Interactive Map Of America’s Carbon Polluters" In a major advance for concerned citizens, the Obama administration has unveiled an interactive website that displays the thousands of major greenhouse gas polluters across the United States.
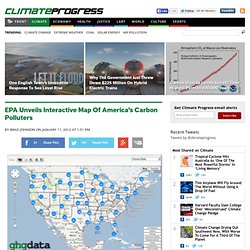
The new site, at ghgdata.epa.gov, features a Google map and charts driven by the greenhouse gas reporting database of facilities that emit 25,000 metric tons or more of greenhouse pollution. The EPA established the rule requiring this reporting in 2009, in response to a law passed under George W. Bush at the end of 2007. This comprehensive and well-designed site, developed by the government contractor SAIC, makes it easy to find out facts like: People can also download the underlying data set for their own analysis.
The site does not display greenhouse pollution from the transportation or agribusiness sectors. Map of the Tornadoes Across the South, Day by Day - Interactive Feature. The Choice of Cities. Cities are technological artifacts, the largest technology we make.
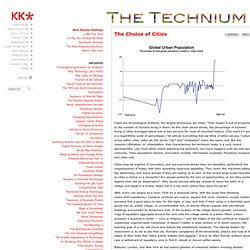
Their impact is out of proportion to the number of humans living in them. As the chart above shows, the percentage of humans living in cities averaged about one or two percent for most of recorded history. (The chart’s Y axis is a logarithmic scale of percentage.) Yet almost everything that we think of when we say “culture” arose within cities. After all, the terms “city” and “civilization” share the same root. Cities may be engines of innovation, but not everyone thinks they are beautiful, particularly the megalopolises of today, with their sprawling rapacious appetites.
Well, every city begins as a slum. Babylon, London, and New York all had seamy ghettos of unwanted settlers erecting shoddy shelters with inadequate hygiene and engaging in dodgy dealings. San Francisco was built by squatters. Skin colour map (indigenous people) - Maps and Graphics at UNEP/GRID-Arendal. The GRID-Arendal Maps & Graphics Library is an on-going project to collect and catalogue all graphic products that have been prepared for publications and web-sites from the last 15 years in a wide range of themes related to environment and sustainable development.
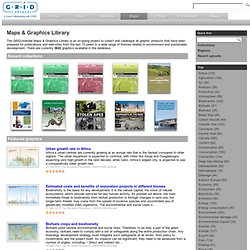
There are currently 3022 graphics available in the database. Urban growth rate in Africa Africa’s urban centres are currently growing at an annual rate that is the fastest compared to other regions. The urban expansion is expected to continue, with cities like Abuja and Ouagadougou expecting very high growth in the next decade, while Cairo, Africa’s largest city, is projected to see a comparatively lower growth rate. 27 Feb 2011 - by Riccardo Pravettoni, UNEP/GRID-Arendal Estimated costs and benefits of restoration projects in different biomes Biodiversity is the basis for any development; it is the natural capital, the stock of natural ecosystems, which provide services for any human activity.
Biofuels crops and biodiversity. Blog_Cola_Large.gif (GIF Image, 971x585 pixels) - Scaled (99%) Crime Map Beta. Multimediafinal.