
TED 2012: New Browser Add-On Visualizes Who Is Tracking You Online. Photo: James Duncan Davidson/TED LONG BEACH, California — In the hour that Mozilla CEO Gary Kovacs lets his 9-year-old daughter surf the web every day, her wanderings have been tracked by dozens of sites.
To some degree, it’s to be expected. Tracking our online behavior is big business. The revenues involved in the top online tracking companies in the space is over $39 billion, Kovacs says. It’s not something that will be slowing any time soon. But that isn’t for a lack of trying. “Privacy is not an option,” Kovacs said in his presentation. Like some color-coded breakdown of alien DNA, Collusion composes a dot matrix diagram composed of grey dots — sites you’ve visited or are visiting — connected to red dots: sites that have passed your browser tracking cookies to monitor your site navigation. “The memory of the internet is forever,” Kovacs said. You can download the browser add-on today at Mozilla’s web site. SoNIA - Social Network Image Animator. Social Network Image Animator What is it?
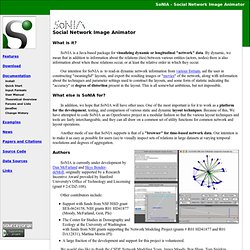
SoNIA is a Java-based package for visualizing dynamic or longitudinal "network" data. By dynamic, we mean that in addition to information about the relations (ties) between various entities (actors, nodes) there is also information about when these relations occur, or at least the relative order in which they occur. Our intention for SoNIA is to read-in dynamic network information from various formats, aid the user in constructing "meaningful" layouts, and export the resulting images or "movies" of the network, along with information about the techniques and parameter settings used to construct the layouts, and some form of statistic indicating the "accuracy" or degree of distortion present in the layout.
This is all somewhat ambitious, but not impossible. What else is SoNIA for? In addition, we hope that SoNIA will have other uses. Another mode of use that SoNIA supports is that of a "browser" for time-based network data. Authors. Highcharts - Interactive JavaScript charts for your webpage. NodeXL to d3.js template. A template for rendering small NodeXL visualisations on the web using the d3.js. Having put in the toil getting my head around the d3.js library I wanted to revisit a problem I had rendering NodeXL generated data in a scalable vector graphic based webpage.
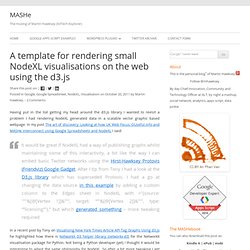
In my post The art of discovery: Looking at how UK Web Focus, OUseful.info and MASHe interconnect using Google Spreadsheets and NodeXL I said: In a recent post by Tony on Visualising New York Times Article API Tag Graphs Using d3.js he highlighted how there is NetworkX D3 helper library (networkx-d3) for the NetworkX visualisation package for Python. Not being a Python developer (yet) I thought it would be interesting to adapt the same philosophy for NodeXL. So after a bit more tweaking I get this rendering of a selection of interconnected posts: Do it yourself Step 1: Preparing the data in NodeXL In your NodeXL spreadsheet: Step 2: Edit the data file So far what we’ve done is prepare the spreadsheet to dump some data. And that should be you. Building blocks for a macro Your still here yeah! d3.js tricks. NodeXL: Network Overview, Discovery and Exploration for Excel - Download: NodeXL Excel Template, version 1.0.1.194.