

R documentation search - All R packages and R manuals from CRAN and Bioconductor. Bioconductor Code Search. R Resources » The R-Podcast. www.stat.auckland.ac.nz/~paul/RGraphics/rgraphics.html. R Graphicsby Paul Murrell The SECOND EDITION of this book is now available, with its own web page.
A book on the core graphics facilities of the R language and environment for statistical computing and graphics (Chapman & Hall/CRC, August 2005). A link to the publisher's web page for the book. A list of Errata. PDF version of the preface, table of contents, and Chapters 1, 4, and 5. Highland Statistics Ltd. Jump straight to Price and Order the book Outline Keywords Table of Contents.
PqR - a pretty quick version of R. Quick-R: Home Page. Cookbook for R » Cookbook for R. Model visualisation. had.co.nz. This page lists my published software for model visualisation.
This work forms the basis for the third chapter of my thesis. classifly: Explore classification boundaries in high dimensions. Given p-dimensional training data containing d groups (the design space), a classification algorithm (classifier) predicts which group new data belongs to. Generally the input to these algorithms is high dimensional, and the boundaries between groups will be high dimensional and perhaps curvilinear or multi-facted. This R package provides methods for visualising the division of space between the groups. clusterfly: Explore clustering results in high dimensions. Typically, there is somewhat of a divide between statistics and visualisation software. There are also some custom methods for certain types of clustering, mostly inspired by the work of Dr Dianne Cook: Self organising maps (aka Kohonen neural networks), ?
10 tips for making your R graphics look their best. So you've spent hours slaving over the code for a beautiful statistical graphic in R, and now you're ready to show it to the world.
You might be printing it, embedding it in a document, or displaying it on the web. Don't do your graph a disservice by causing it to look anything less than perfect in its final venue. Here are 10 tips to help make sure your graphic will always look best. 1. Call the right device driver from a script It's tempting to just create graphics to the on-screen device (such as X11 on Linux or Quartz on MacOS) and then just use "Save As... " from the menu. The best practice is to create a script file that begins with a call to the device driver (usually pdf or png), runs the graphics commands, and then finishes with a call to dev.off(). Png(file="mygraphic.png",width=400,height=350)plot(x=rnorm(10),y=rnorm(10),main="example")dev.off() 2.
If you plan to print your graphic, you want to use a vector-based format. R and Data Mining. Juice Labs - Chart Chooser. Creating a Quick Report with knitr, xtable, R Markdown, Pandoc (and some OpenBLAS Benchmark Results) Welcome · Advanced R. Building an R Hadoop System - RDataMining.com: R and Data Mining. This page shows how to build an R Hadoop system, and presents the steps to set up my first R Hadoop system in single-node mode on Mac OS X.
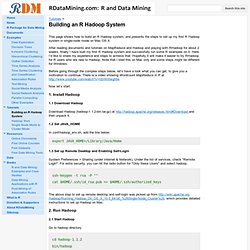
After reading documents and tutorials on MapReduce and Hadoop and playing with RHadoop for about 2 weeks, finally I have built my first R Hadoop system and successfully run some R examples on it. Here I’d like to share my experience and steps to achieve that. Hopefully it will make it easier to try RHadoop for R users who are new to Hadoop. Note that I tried this on Mac only and some steps might be different for Windows.
Before going through the complex steps below, let’s have a look what you can get, to give you a motivation to continue. Now let’s start. 1. Twotorials by anthony damico. Bioconductor Code Search. R Programming. Welcome to the R programming Wikibook This book is designed to be a practical guide to the R programming language[1].
R is free software designed for statistical computing. There is already great documentation for the standard R packages on the Comprehensive R Archive Network (CRAN)[2] and many resources in specialized books, forums such as Stackoverflow[3] and personal blogs[4], but all of these resources are scattered and therefore difficult to find and to compare.
The aim of this Wikibook is to be the place where anyone can share his or her knowledge and tricks on R. It is supposed to be organized by task but not by discipline[5]. How can you share your R experience ? Explain the syntax of a commandCompare the different ways of performing each task using R.Try to make unique examples based on fake data (ie simulated data sets).As with any Wikibook please feel free to make corrections, expand explanations, and make additions where necessary. Some rules : Prerequisites[edit] See also[edit] Cookbook for R » Cookbook for R. Developers:projects:gsoc2012:ropensci. Summary: Dynamic access and visualization of scientific data repositories Description: rOpenSci is a collaborative effort to develop R-based tools for facilitating Open Science.
Projects in rOpenSci fall into two categories: those for working with the scientific literature, and those for working directly with the databases. Visit the active development hub of each project on github, where you can see and download source-code, see updates, and follow or join the developer discussions of issues. Most of the packages work through an API provided by the resource (database, paper archive) to access data and bring it within reach of R’s powerful manipulation. See a complete list of our R packages currently in development. The student could choose to work on a package for a particular data repository of interest, or develop tools for visualization and exploration that could function across the existing packages. Summer 2010 — R: ggplot2 Intro. Contents Intro When it comes to producing graphics in R, there are basically three options for your average user. base graphics I've written up a pretty comprehensive description for use of base graphics here, and don't intend to extend beyond that.
Base graphics are attractive, and flexible, but when it comes to creating more complex plots, like this one, the code to create it become more cumbersome. RStudio Server Amazon Machine Image (AMI) - Louis Aslett. Current AMI Quick Reference (27nd Jun 2015)Amazon instance type reference Click to launch through AWS web interface: What’s new recently?
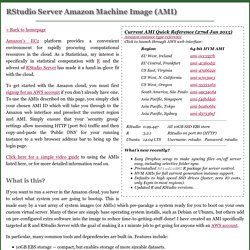
Easy Dropbox setup to make syncing files on/off server easy, including selective folder sync. Learning R. Show posts - BioStar. Book. Github:help. R Reference Card.
R packages. Packages sources. Resources to help you learn and use R. R - Getting Started in Data Analysis - Princeton LibGuides at Princeton University.