
Rubular: a Ruby regular expression editor and tester. Introduction to R - DataCamp. Learning R. GeoSeq. www.r-sprint.org. MultiFinder homepage. MultiFinder The software is available here via an academic license.
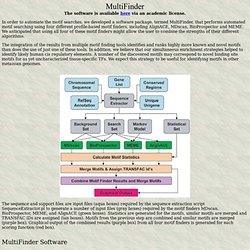
In order to automate the motif searches, we developed a software package, termed MultiFinder, that performs automated motif searching using four different profile-based motif finders, including AlignACE, MDscan, BioProspector and MEME. We anticipated that using all four of these motif finders might allow the user to combine the strengths of their different algorithms. The integration of the results from multiple motif finding tools identifies and ranks highly more known and novel motifs than does the use of just one of these tools.
In addition, we believe that our simultaneous enrichment strategies helped to identify likely human cis regulatory elements. The sequence and support files are input files (aqua boxes) required by the sequence extraction script SequenceExtractor.pl to generate a number of input files (gray boxes) required by the motif finders MDscan, BioProspector, MEME, and AlignACE (green boxes). Addicted to R · academic/hacker. Interactive Playground for R Packages: Part 1 2014-03-20 In this post, I will show you how to create interactive playgrounds for R packages using AngularJS and OpenCPU.
I will use the live playground application that I created for rCharts to illustrate the basic idea, which can easily be extended to other packages. rblocks Package v 0.1 2014-03-14 This is a revised post on rblocks, based on some excellent suggestions from Hadley Wickham, Paul Murell and others, on how to enrich the visual representation of data structures. I have also combined some `d3js` goodness, that you can see towards the end of the post! Verbatim Chunks in R Markdown 2014-03-12 This is a short post on how to print knitr code chunks verbatim, preserving all the markup along with chunk options. The miRNA body-map. Software and Programmer Efficiency Research Group. Our research often involves quantitative studies producing large amounts of data.
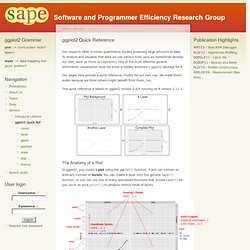
To analyze and visualize that data we use various tools (and we sometimes develop our own, such as Trevis or LagAlyzer). One of the most effective general information visualization tools we know is Hadley Wickham's ggplot2 package for R. Our pages here provide a quick reference, mostly for our own use. We made them public because we think others might benefit from them, too. This quick reference is based on ggplot2 version 0.8.8 running on R version 2.11.1. The Anatomy of a Plot In ggplot2, you create a plot using the ggplot() function. Besides a list of layers, a plot also has a coordinate system, scales, and a faceting specification. Each layer uses a specific kind of statistic to summarize data, draws a specific kind of geometric object (geom) for each of the (statistically aggregated) data items, and uses a specific kind of position adjustment to deal with geoms that might visually obstruct each other.
CancerMiner. Quantifying Memory: Plugging hierarchical data from R into d3. Here I show how to convert tabulated data into a json format that can be used in d3 graphics.
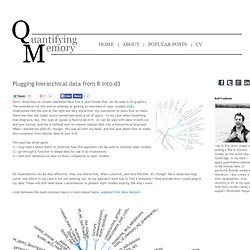
The motivation for this was an attempt at getting an overview of topic models (link). Illustrations like the one to the right are very attractive; my motivation to learn how to make them was that the radial layout sometimes saves a lot of space - in my case when visualising tree diagrams. But, this type of layout is hard to do in R. d3 can be used with data in both csv and json format, and has a method 'nest' to convert tabular data into a hierarchical structure. When I started out with d3, though, this was all over my head, and this post shows how to make the conversion from tabular data to json in R.
This post has three parts: 1) I map topics about Stalin to illustrate how this approach can be used to visualise topic models 2) I go through a function to shape data for use in d3 illustrations 3) I end with variations on how to show complexity in topic models. Knitr in a knutshell. Data Science - Community. User guide. This page presents a hands on introduction to Bio3D and the R environment.
It is intended to familiarize the user with a few essentials important for getting off to a quick start. In the examples below we assume that you have successfully installed R and the Bio3D package, by following the installation instructions on the Download page. Extended installation instructions are also available as a PDF for download. This page contains the following sections: A number of worked examples are available as extensive Tutorials. Introduction R is a software environment for statistical computing and graphics. An effective data handling and storage facility, a suite of operators for calculations on arrays, in particular matrices, a large, coherent, integrated collection of intermediate tools for data analysis, graphical facilities for data analysis and display either on-screen or on hardcopy, and a well-developed, simple and effective programming language.
Slidify. Web-Scraping: the Basics. Package NeatMap. R code style guide.
Databases. Bioinformatics. Mybiosoftware_interesting. RR. R-project. R.