
Algorithm Visualizer. MCL Presentation2. Agile Visualization. Agile Visualization is supported by open-source communites, research laboratories, and companies.
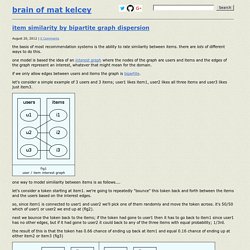
Thanks to all of you! In particular, we thanks Object Profile, Lam Research, RMoD, Synectique, Commissariat à l'Énergie Atomique et aux Énergies Alternatives (CEA), Komponentenwerkstatt. Brain of mat kelcey. The basis of most recommendation systems is the ability to rate similarity between items. there are lots of different ways to do this. one model is based the idea of an interest graph where the nodes of the graph are users and items and the edges of the graph represent an interest, whatever that might mean for the domain. if we only allow edges between users and items the graph is bipartite. let's consider a simple example of 3 users and 3 items; user1 likes item1, user2 likes all three items and user3 likes just item3. one way to model similiarity between items is as follows....
How a Kalman filter works, in pictures. I have to tell you about the Kalman filter, because what it does is pretty damn amazing.
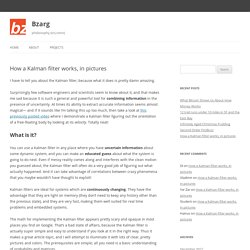
Surprisingly few software engineers and scientists seem to know about it, and that makes me sad because it is such a general and powerful tool for combining information in the presence of uncertainty. At times its ability to extract accurate information seems almost magical— and if it sounds like I’m talking this up too much, then take a look at this previously posted video where I demonstrate a Kalman filter figuring out the orientation of a free-floating body by looking at its velocity. Totally neat! Adam Drake. Introduction As I was browsing the web and catching up on some sites I visit periodically, I found a cool article from Tom Hayden about using Amazon Elastic Map Reduce (EMR) and mrjob in order to compute some statistics on win/loss ratios for chess games he downloaded from the millionbase archive, and generally have fun with EMR.
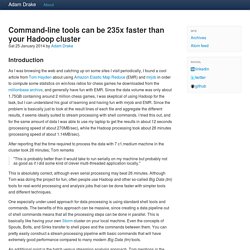
Since the data volume was only about 1.75GB containing around 2 million chess games, I was skeptical of using Hadoop for the task, but I can understand his goal of learning and having fun with mrjob and EMR. Since the problem is basically just to look at the result lines of each file and aggregate the different results, it seems ideally suited to stream processing with shell commands.
I tried this out, and for the same amount of data I was able to use my laptop to get the results in about 12 seconds (processing speed of about 270MB/sec), while the Hadoop processing took about 26 minutes (processing speed of about 1.14MB/sec). Learn about the data. Where Are The Jobs? Where Are The Jobs?

Employment in America, 2010 Leaflet | Jobs: Map data from US Census LEHD, Imagery by Robert Manduca under CC BY 4.0, Background: Map tiles by Stamen Design, under CC BY 3.0. Reading List « Deep Learning. Mode Trees.
Presentation on The Mode Tree at Papers We Love Too - adereth. Multimodality = subpopulation OR cluster. Lepski , Spokoiny : Optimal pointwise adaptive methods in nonparametric estimation. The problem of optimal adaptive estimation of a function at a given point from noisy data is considered.

Two procedures are proved to be asymptotically optimal for different settings. First we study the problem of bandwidth selection for nonparametric pointwise kernel estimation with a given kernel. We propose a bandwidth selection procedure and prove its optimality in the asymptotic sense. BootAnim - Bootstrap Animations. This page shows animations of the simple bootstrap in various contexts.
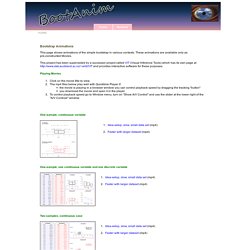
These animations are available only as pre-constructed Movies. This project has been superceded by a successor project called VIT (Visual Inference Tools) which has its own page at and provides interactive software for these purposes. Playing Movies Click on the movie title to view. The mp4 files below play well with Quicktime Player if: the movie is playing in a browser window you can control playback speed by dragging the tracking "button" you download the movie and open it in the player. One-sample, continuous variable One-sample, one continuous variable and one discrete variable. Confidence interval for a median and other quantiles. Produto para diagnosticar qdo funcionários deixam a empresa. Workday Talent Insights can predict when employees will leave - Business Insider.
Faixas Salariais x Classe Social - Qual a sua classe social? Por Thiago Rodrigo Alves CarneiroEm 26.11.2013 04:26310133 visualizações Há vários critérios para definir classes sociais, sem uma predileção específica na literatura.
Saiba mais sobre dois dos critérios mais utilizados: o critério brasil e o critério por faixas de salários-mínimo. TechWars - Technology Comparison & Monitoring. When Big Data Becomes Too Much Data. About 2.5 exabytes of data will be generated today, or roughly the amount of data that was generated from the dawn of time until 2004.
What’s in there, and will any of it be useful? The reality is the amount of data is so vast, its quality so dubious, and our abilities so relatively weak that most of it will have no impact whatsoever. In a perfect world, each additional byte of data we generate and absorb would shave a little bit more uncertainty away from our models and help us get closer to truth as it exists in nature. Vfdt-journal.pdf.