
Blog. This year, “School” topped the list of things Twitterers are giving up for Lent, up 44 places from last year.

Remaining in the top ten from last year are Swearing, Alcohol, Soda, Social Networking, and Fast Food. Chocolate, Twitter, Sweets, and Lent round out the new additions to the top ten. I don’t have a great explanation for why School is #1 this year–it could be that Ash Wednesday is later this year, so spring break is closer (for some it even starts today). Chris Harrison - Visualizing the Bible. This set of visualizations started as a collaboration between Christoph Römhild and myself.
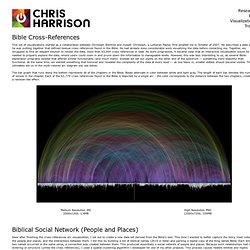
Christoph, a Lutheran Pastor, first emailed me in October of 2007. He described a data set he was putting together that defined textual cross references found in the Bible. He had already done considerable work visualizing the data before contacting me. Together, we struggled to find an elegant solution to render the data, more than 63,000 cross references in total. As work progressed, it became clear that an interactive visualization would be needed to properly explore the data, where users could zoom in and prune down the information to manageable levels. Mapping God's Bloodline. Follow the genealogy of Jesus from the creation of Adam and Eve through Noah, the tribes of Israel, King David, and finally Joseph and Mary.
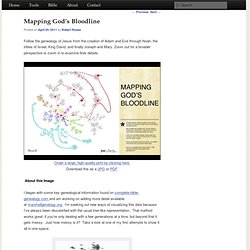
Zoom out for a broader perspective or zoom in to examine finer details. I began with some key genealogical information found on complete-bible-genealogy.com and am working on adding more detail available at marshallgenalogy.org. I’m seeking out new ways of visualizing this data because I’ve always been dissatisfied with the usual tree-like representation. That method works great if you’re only dealing with a few generations at a time, but beyond that it gets messy. Just how messy is it?