
Fractals and Complexity. Fractals and Complexity How would you characterize the images on this page?
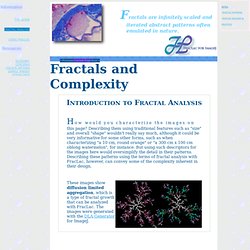
Describing them using traditional features such as "size" and overall "shape" wouldn't really say much, although it could be very informative for some other forms, such as when characterizing "a 10 cm, round orange" or "a 300 cm x 100 cm oblong watermelon", for instance. But using such descriptors for the images here would oversimplify the detail in their patterns. M e t a m o r p h o p t i c s. Mathematical visualization. The Mandelbrot set, one of the most famous examples of mathematical visualization.
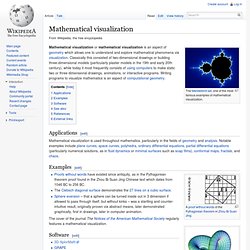
Applications[edit] Mathematical visualization is used throughout mathematics, particularly in the fields of geometry and analysis. Notable examples include plane curves, space curves, polyhedra, ordinary differential equations, partial differential equations (particularly numerical solutions, as in fluid dynamics or minimal surfaces such as soap films), conformal maps, fractals, and chaos. Examples[edit] Mandelbrot set. Initial image of a Mandelbrot set zoom sequence with a continuously colored environment Mandelbrot animation based on a static number of iterations per pixel remains bounded.[1] That is, a complex number c is part of the Mandelbrot set if, when starting with z0 = 0 and applying the iteration repeatedly, the absolute value of zn remains bounded however large n gets.
Fractals, in Layman's Terms. The Elegant Universe: Pt 1. The Elegant Universe: Part 3.

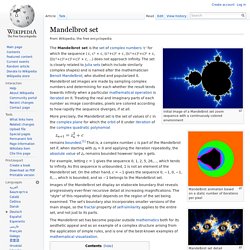
Fractal Repository. June 2010. In Fractal Finance, Part I we saw that fractals can be useful in describing complex, seemingly chaotic patterns in nature.

We also saw how Wall Street took advantage of the same advances in information technology that made the study of fractals possible starting in the 1980s, to come up with computer-driven black-box trading schemes. For example, index arbitrage strategies were widely blamed for the Black Monday crash of October 1987. Wall Street is always on the look-out for new "angles", opportunities to better skin a cat in a place already full of very sharp razors. The sheer quantity of money moving around attracts very bright individuals, at least the variety who get high on making as much money as possible with the seat of their pants and the money of others. Wall Street is also home to some of the hugest and most ruthless egos to be found anywhere, resulting in a kind of kindergarten for genius gunslingers, but that's material for a subsequent post.
The Math Less Traveled. Interesting numbers - Imaginary and complex numbers. Interesting numbers --- zero --- one --- complex --- root 2 --- golden ratio --- e --- pi --- googol --- infinity What is i?
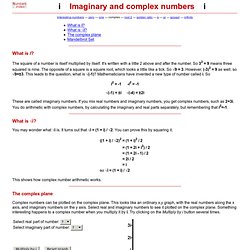
The square of a number is itself multiplied by itself. It's written with a little 2 above and after the number. So 32 = 9 means three squared is nine. Unveiling the Mandelbrot set. September 2006 Back in the 1970s and 1980s, mathematicians working in an area called dynamical systems made use of the ever-advancing computing power to draw computer images of the objects they were working on.
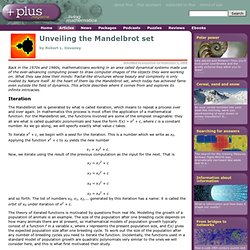
What they saw blew their minds: fractal-like structures whose beauty and complexity is only rivalled by Nature itself. At the heart of them lay the Mandelbrot set, which today has achieved fame even outside the field of dynamics. This article describes where it comes from and explores its infinite intricacies. Iteration The Mandelbrot set is generated by what is called iteration, which means to repeat a process over and over again.
To iterate x2 + c, we begin with a seed for the iteration. x1 = x02 + c. A Global Geometric Framework for Nonlinear Dimensionality Reduction. Scientists working with large volumes of high-dimensional data, such as global climate patterns, stellar spectra, or human gene distributions, regularly confront the problem of dimensionality reduction: finding meaningful low-dimensional structures hidden in their high-dimensional observations.

The human brain confronts the same problem in everyday perception, extracting from its high-dimensional sensory inputs—30,000 auditory nerve fibers or 106 optic nerve fibers—a manageably small number of perceptually relevant features. Here we describe an approach to solving dimensionality reduction problems that uses easily measured local metric information to learn the underlying global geometry of a data set. Uncoiling the spiral: Maths and hallucinations. December 2009 You can read a more accessible version of this article here.
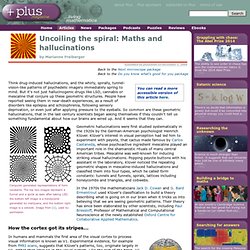
Think drug-induced hallucinations, and the whirly, spirally, tunnel-vision-like patterns of psychedelic imagery immediately spring to mind. But it's not just hallucinogenic drugs like LSD, cannabis or mescaline that conjure up these geometric structures. People have reported seeing them in near-death experiences, as a result of disorders like epilepsy and schizophrenia, following sensory deprivation, or even just after applying pressure to the eyeballs. So common are these geometric hallucinations, that in the last century scientists began asking themselves if they couldn't tell us something fundamental about how our brains are wired up.
Computer generated representations of form constants. Geometric hallucinations were first studied systematically in the 1920s by the German-American psychologist Heinrich Klüver. In the 1970s the mathematicians Jack D. How the cortex got its stripes... Animal pattern equations and .