

Formatting Dynamic Data in Gephi. Www.clementlevallois.net/gephi/tuto/gephi_tutorial_dynamics.pdf. Gephi – curated list of tutorials. Introduction to Network Visualization with GEPHI. Gephi workshop at University of Bern (photo Radu Suciu) Social Network Analysis is a lens, a way of looking at reality.

(Claire Lemercier at Swiss Digital Humanities Summer School 2013) Social Network Analysis (SNA) appears to be an interesting tool to give the researcher the ability to see its data from a new angle. Because Gephi is an easy access and powerful network analysis tool, here is a tutorial that should allow everyone to make his first experiments. I propose below, after a short introduction about the basis of SNA and some examples which shows the potential of this tool, a transcript of a workshop given at the first Digital Humanities summer school in Switzerland (June 28. 2013). 1.
A network consists of two components : a list of the actors composing the network, and a list of the relations (the interactions between actors). By left, you can observe a very simple social graph, with both lists explicited. 2. 3. GephiDataset(edges)Dataset (nodes) 4. Nodes Edges 5. Nodes’ size 6. 7. Get Your Data into Gephi: A Quick and Basic Tutorial.
If you’re interested in learning more about information visualization by trying out some yourself, here’s a quick tutorial on how to get a very basic dataset showing character relationships from a piece of literature into Gephi!
You might also check out my posts on the Bloomsday Ulysses visualization project (this year’s more in-depth analysis, last year’s smaller project), Gephi tutorials (how I used Gephi for my “View DHQ” DH knowledge networks project, Gephi terminology and ideas for exploration), and ACH Microgrant visualization work. Basic Gephi Dataset Creation In the Bloomsday project, we recorded data about what character interacted with which other characters, and used a scale of 1-7 to indicate the perceived intimacy of those interactions (e.g. from one person thinking of another person, to an involved conversation between two people). Here’s an example of these two columns in the Bloomsday visualization dataset: Source Target Weight John Jim 2 John Jane 1 Jane Jim 2 What Now?
Tutorial Visualization. This is an introduction tutorial about visualization in Gephi.

It will guide you to the basic and advanced visualization settings in Gephi. The selection and interaction with tools will also be introduced. Available in other languages: Japanese Follow the Quick Start tutorial to learn the basic steps. Tutorial: Download it in PDF. The tutorial follows the following steps and use the Airlines sample dataset. IntroductionZoom & PanSelectionColor3-DLabelsText sizeText colorAdjust labelsAttributes textText & SelectionScreenshotsAntialiasingToolsTransform textsConclusion. Tutorial Visualization. Quick Start. Available in other languages: Japanese Tutorial: Download it in PDF.

The tutorial follows the following steps with LesMiserables sample dataset. You can find other network datasets on the wiki. Social Network Analysis using R and Gephis. After learning the basics of R, I decided to learn something harder last week.

I picked Social Network Analysis (SNA) to learn the concepts of SNA and R. My primary interest in SNA is visual exploration of networks, so I needed to find a tool first. Data visualization - R & Gephi: edges in a network are not properly imported using the rgexf package. Convert igraph R objects to GePhi gexf format. Contents Make Vectorize your friend for R Before we jump to GePhi and iGraph conversions, you might want to know something about Vectorization.

Old habits die hard. For someone coming from linear programming models such as C++ or Java, it takes quite a bit of effort before a fully-compliant R functions can be developed. The major pit-fall is, defining a function that is not vector-compliant. For example, consider the below function that accepts two numbers and returns some computed value based on them. getNc2 = function(vc, ec) { # compute nC2 and return the ratio max_ec = vc * (vc-1) / 2 return (trunc(ec * 100 / max_ec)) } This is a valid function in R, and perhaps similar to any C++ or Java method, except it works on both single number input and vector inputs. > getNc2(5, 4) [1] 40 > getNc2(6, 5) [1] 33 Now, those two calls can be combined into a single vector call as below and our above definition works perfectly fine without complaints:
Learn how to use Gephi. Welcome to Gephi!

Gephi is an open-source software for visualizing and analysing large networks graphs. Gephi uses a 3D render engine to display graphs in real-time and speed up the exploration. You can use it to explore, analyse, spatialise, filter, cluterize, manipulate and export all types of graphs. Getting Started New to Gephi? Quick Start Guide Supported Graph File Formats Official Tutorials Gephi is really easy to handle if you learn the basics. Popular Tutorials by the Community: Convert igraph R objects to Gexf GePhi format - Weblog of Gopalakrishna Palem. Very useful.
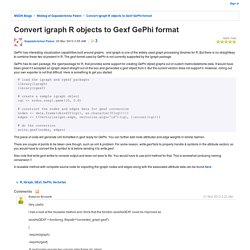
I had a look at the reusable method and I think that the function saveAsGEXF could be improved as saveAsGEXF = function(g, filepath="converted_graph.gexf")