
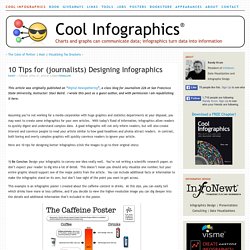
Data Visualization, Information Design and Infographics. iGraphics explained. LLC - Portfolio. 10 Tips for (journalists) Designing Infographics. This article was originally published on “Digital Newsgathering”, a class blog for Journalism 226 at San Francisco State University, Instructor: Staci Baird.
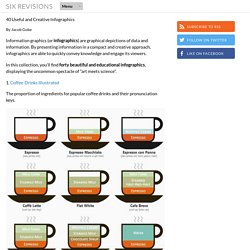
I wrote this post as a guest author, and with permission I am republishing it here. Assuming you’re not working for a media corporation with huge graphics and statistics departments at your disposal, you may want to create some infographics for your own articles. With today’s flood of information, infographics allow readers to quickly digest and understand complex data. A good infographic will not only inform readers, but will also create interest and convince people to read your article similar to how good headlines and photos attract readers. In contrast, both boring and overly complex graphics will quickly convince readers to ignore your article. Here are 10 tips for designing better infographics (click the images to go to their original sites): Gallery. 40 Useful and Creative Infographics. Six Revisions Menu Main Categories CSS HTML JavaScript Web Design WordPress Web Development Design Inspiration UX Design UI Design Freebies Tutorials Tools Links About Contact Advertise RSS Twitter Facebook 40 Useful and Creative Infographics.
InfoGraphic Designs: Overview, Examples and Best Practices. Information graphics or infographics are visual representations of information, data or knowledge.
These graphics are used where complex information needs to be explained quickly and clearly, such as in signs, maps, journalism, technical writing, and education. They are also used extensively as tools by computer scientists, mathematicians, and statisticians to ease the process of developing and communicating conceptual information. They can present a rich amount of information without intimidating you. Or sometimes they intimidate you, but make the digesting of the information much more bearable. Here in this article below, we are going to discuss best practices for designing infographics followed by some examples which might help you learn a thing or two. You may be interested in the following related articles as well. Create cool infographics - Masterclass. 10 Awesome Free Tools To Make Infographics. Advertisement Who can resist a colourful, thoughtful venn diagram anyway?

In terms of blogging success, infographics are far more likely to be shared than your average blog post. This means more eyeballs on your important information, more people rallying for your cause, more backlinks and more visits to your blog. In short, a quality infographic done well could be what your blog needs right now. Visualising Data » Resources. Visualizing.org. NYTLabs Cascade: How Information Propagates through Social Media. What happens if you bring together Jer Thorp , known of many beautiful data representations, and Mark Hansen , UCLA statistics professor and one of the people behind the Moveable Type installation , together at the NYTLabs , which is the research and development lab of The New York Times Company. Well, you get Cascade [nytlabs.com], a 3D interactive visualization tool that reveals how information propagates through social media space by linking the browsing behavior on the NYTimes website with the corresponding social activity in terms of content and URL sharing.
In short, the tool aims to reveal the causal factors that determine how tweets about news stories are propagated in the most succesful ways. For instance, the visualization already can demonstrate how viral popularity is mostly influenced by the people who are followed by famous people, who in turn drive a lot of online discussions and retweet activity. Infographics news. 20 Useful Visualization Libraries. How To Create Outstanding Modern Infographics. In this tutorial you will learn that data doesn't have to be boring, it can be beautiful!

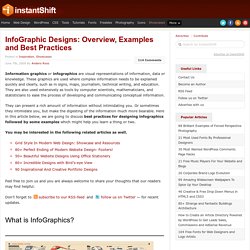
Learn how to use various graph tools, illustration techniques and typography to make an accurate and inspiring infographic in Adobe Illustrator. Start by using the Rectangle Tool (M) to draw a shape. Give it a subtle radial gradient too. The entire design is based on a grid of four columns. To make the columns first select the rectangle and drag a guide onto the centre of the shape. Condense the shape so it fits within the left-most guide and centre guide. Move the shape over to the right and add another guide to the centre here. Using the Rectangle Tool (M) draw a thin white box on the centre line that will be the width of the gap between the columns.
Repeat the process for the other columns with your final result being below. 6 Inspiring Examples of Animation Infographics. Perhaps the best option for spicing up otherwise bland content such as graphs and text is by incorporating details into an infographic animation.

Infographic animations combine motion, audio and graphic design to provide stellar compilations for content-hungry audiences. To increase your awareness of and appreciation for the art of animation infographics, here are 6 inspiring examples of this trend. DNA Test Results Ever been slightly boggled at the statistics passed along from medical exams? Consider incorporating them into an animation infographic to simplify the information.
Facebook Infographic Ah Facebook, you just can’t escape it. History of the Internet. Infographics.eu.