
Analytic Tools. Visualising Data » Blog Archive » 10 significant visualisation developments: January to June 2014. To mark the milestone of each mid-year and end of year I try to take a reflective glance over the previous 6 months period in the data visualisation field and compile a collection of some of the most significant developments.
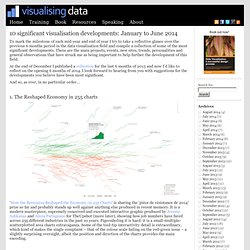
These are the main projects, events, new sites, trends, personalities and general observations that have struck me as being important to help further the development of this field. At the end of December I published a collection for the last 6 months of 2013 and now I’d like to reflect on the opening 6 months of 2014. I look forward to hearing from you with suggestions for the developments you believe have been most significant. And so, as ever, in no particular order… 1. ‘How the Recession Reshaped the Economy, in 255 Charts‘ is sharing the ‘pièce de résistance de 2014′ prize so far and probably stands up well against anything else produced in recent memory. Brainpickings.
Let's focus Export - Mapping Tools Radar visual literacy.pos. Version 2.6.
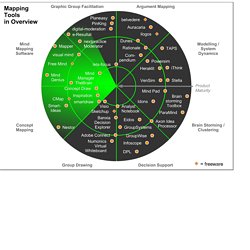
A simple and versatile visual brainstorming software supporting a variety of visual templates and methods (incl. mind mapping). www.mind-pad.com The Headcase Mind Mapper is a reasonably priced mind mapping program that - according to some reviews- is still quite buggy. www.nobox.de A comprehensive, high-quality mapping suite enabling concept and mind maps, as well as a variety of other formats, such as network diagrams or technical drawings. www.conceptdraw.com/ Supports a whole range of mapping methods, incl. Www.smartdraw.com Based on the cognitive mapping approach, Banxia's decision explorer helps group clarify their rationale and reach consensus-based decisions. www.banxia.com Powersim is a commercial, full scale simulation and network diagramming software.
Online Mind Mapping and Brainstorming app - SpiderScribe. Active players in a network tell the story: Parsimony in modeling huge networks. Méthodes d'analyse. Brainstorm and mind map online. The mind-mapping.org Blog » This blog is about software for mindmapping and organising information. This blog will keep you bang up to date on developments in the world of visual networks and all types of business maps.
Mind maps Mindmapinspiration’s Gallery Mindmapinspiration has a Gallery and, as usual with Paul Foreman’s inspiring work, it’s great.
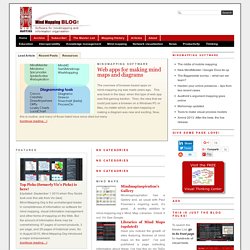
A worthy addition to mind-mapping.org’s Mind Map Libraries. 15 Effective Tools for Visual Knowledge Management. Since I started my quest a few years ago searching for the ultimate knowledge management tool, I’ve discovered a number of interesting applications that help people efficiently organize information.
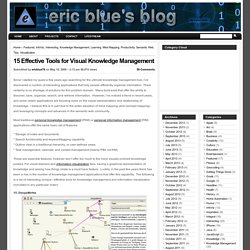
There certainly is no shortage of solutions for this problem domain. Many tools exist that offer the ability to discover, save, organize, search, and retrieve information. Selected Tools. Software for social network analysis. Social Network Analysis and Visualisation for #RDAPlenary 3. Twitter is a great source of information as well as a fantastic communication tool on specific event.
In our – academic – world conferences are one of the most commonly occurring events, where a significant degree of communication between participants now happen on Twitter. Last week Dublin was hosting the Research Data Alliance Plenary 3 with over 400 participants. It was organised by Insight Centre and the DRI, as well as other partners from Australia, Europe and US. We were assisting the organising committee with the event’s social media, part of which we demonstrated the top tweeters for each day and also the top tweeters and the top retweeteds for the whole conference.
A great free Social Network Analysis Tool. Learn how to use Gephi. Welcome to Gephi!
Gephi is an open-source software for visualizing and analysing large networks graphs. Gephi uses a 3D render engine to display graphs in real-time and speed up the exploration. You can use it to explore, analyse, spatialise, filter, cluterize, manipulate and export all types of graphs. Getting Started. Networks and Structural Change. “Ultimately if we are to avoid failure in the most critical work of this century, the deepest reaches of our beings must be brought to bear in honestly reevaluating and shifting the most basic structures of our society.” - john a. powell The following is a textual recapturing of a Pecha Kucha-like presentation that I gave at an ARNOVA Pre-Conference Session in Hartford, CT two weeks ago.
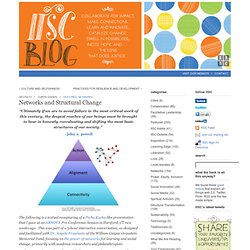
This was part of a 3-hour interactive conversation, co-designed and facilitated with Dr. Networks as Responsible Structures. Jul/23/14//Curtis Ogden//Networks There is growing awareness that current organizational structures can breed irresponsibility.
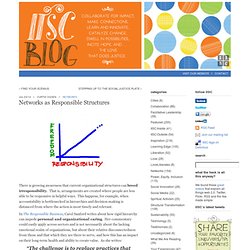
That is, arrangements are created where people are less able to be responsive in helpful ways. This happens, for example, when accountability is bottlenecked in hierarchies and decision-making is distanced from where the action is most timely and relevant. Early Warning Signs in Social-Ecological Networks. A number of social-ecological systems exhibit complex behaviour associated with nonlinearities, bifurcations, and interaction with stochastic drivers.
These systems are often prone to abrupt and unexpected instabilities and state shifts that emerge as a discontinuous response to gradual changes in environmental drivers. Predicting such behaviours is crucial to the prevention of or preparation for unwanted regime shifts. Recent research in ecology has investigated early warning signs that anticipate the divergence of univariate ecosystem dynamics from a stable attractor. To date, leading indicators of instability in systems with multiple interacting components have remained poorly investigated. A Network Way of Working: A Compilation of Considerations about Effectiveness in Networks. “Wrap” by Kevin Dwyer/www.wooburntaichi.co.uk “In groups we can do together what we cannot achieve alone.
With networks and new computer-based tools now ordinary people can become a group even without the benefit of a corporation or organization. They can make decisions, own and sell assets, accomplish tasks by exploiting the technology available. RStudio - Home. Social Network Analysis & an Introduction to Tools. EOLSSComplexityRising. Santa Fe Institute. Urban Scaling and Its Deviations: Revealing the Structure of Wealth, Innovation and Crime across Cities. With urban population increasing dramatically worldwide, cities are playing an increasingly critical role in human societies and the sustainability of the planet. An obstacle to effective policy is the lack of meaningful urban metrics based on a quantitative understanding of cities. Typically, linear per capita indicators are used to characterize and rank cities. However, these implicitly ignore the fundamental role of nonlinear agglomeration integral to the life history of cities.
As such, per capita indicators conflate general nonlinear effects, common to all cities, with local dynamics, specific to each city, failing to provide direct measures of the impact of local events and policy. Albert-Laszlo Barabasi - Web Science Meets Network Science Workshop. » Doing Social Network Analysis using Qualitative Methods The Sociological Imagination. Step by Step Social Network Analysis using Gephi: Getting Started.
Sources And Methods: The Potential of Social Network Analysis in Intelligence. (In case you missed our most recent article over at e-International Relations or at OODALoop, we are reprinting it here!) The legality of the National Security Agency’s (NSA’s) use of US citizens’ metadata to identify and track foreign intelligence organizations and their operatives is currently a subject of much debate. Less well understood (and consequently routinely misreported) are the capabilities and limitations of social network analysis, the methodology often used to evaluate this metadata. One of the first causes of confusion is definitional. Social network analysis is often linked to an inappropriate degree with social media.
True, social media such as Facebook and Twitter are frequently used as rich data sources for social network analysis, but understanding the importance of networks in the affairs of states has been around at least since Machiavelli.[1] Introduction to Network Visualization with GEPHI. New tutorial available! A completely new version of this tutorial has been published, with 2 complete and complementary datasets to learn and explore many basic and advanced features of Gephi: To the new tutorial Gephi workshop at University of Bern (photo Radu Suciu) Social Network Analysis is a lens, a way of looking at reality. (Claire Lemercier at Swiss Digital Humanities Summer School 2013) Robert Hanneman's Homepage. 1402.0218v3. OECD – Your Better Life Index. Average personal index for Germany, men, 15–24 How’s life? There is more to life than the cold numbers of GDP and economic statistics – This Index allows you to compare well-being across countries, based on 11 topics the OECD has identified as essential, in the areas of material living conditions and quality of life.
Download executive summary Download the index data Learn more about the index. Brainstorm and mind map online. Measurefest: network mapping and visualising relative influence - Brilliant Noise. Last week I spoke at Measurefest, a conference dedicated to analytics, marketing measurement and CRO. The topic of my talk was, “Network mapping and visualising relative influence”. In case you missed it, here it is in blog form… We need to move on from basic influencer identification based on Twitter bios, to finding people based on their network connections.Drawing networks on NodeXL can visually communicate the meaning of relevance in influencer identification to senior stakeholders.And we can use conversational data from influencer networks to inform and evaluate content strategy.
Let’s look at basic influencer identification first. When we’re trying to find influential people around a key topic, we’re likely to search Twitter bios for related keywords, to search Twitter conversations, maybe using buzz monitoring software like Brandwatch, and to search blogs based on the title and content of the blog. So when we do basic influencer mapping like this, the results are useful. Inform:
Gephi, an open source graph visualization and manipulation software. Gephi Quick Start. Available in other languages: Japanese Tutorial: Download it in PDF. The tutorial follows the following steps with LesMiserables sample dataset. You can find other network datasets on the wiki. Import file Visualization Layout Ranking (color) Metrics Ranking (size) Layout again Show labels Community-detection Partition Filter Preview Export Save.