
Using Storyboards and Sentiment Charts to Quantify Customer Experience. By Ben Crothers Published: November 7, 2011 “Storyboards are appealing at an aesthetic level, but are trickier to use in persuading clients who are more used to cold, hard numbers, charts, and tables.”
In the fields of user experience and service design, we use storyboards to illustrate our solutions, so clients can walk in the shoes of their customers, staff, or community and see our solutions as we see them. Storyboards are appealing at an aesthetic level, but are trickier to use in persuading clients who are more used to cold, hard numbers, charts, and tables. Value network analysis. Value network analysis is a methodology for understanding, using, visualizing, optimizing internal and external value networks and complex economic ecosystems.
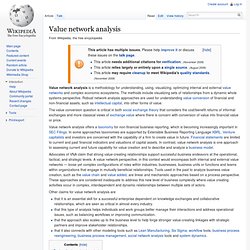
The methods include visualizing sets of relationships from a dynamic whole systems perspective. Robust network analysis approaches are used for understanding value conversion of financial and non-financial assets, such as intellectual capital, into other forms of value.