
RAND State Statistics
The RAND Corporation is a research organization that develops solutions to public policy challenges to help make communities
Health Insurance in States and Counties. Posted by RAND State Statistics on January 23rd, 2021 Persons Without Health Insurance Concentrated in South.
Federal Individual Income Tax Returns by State, County, and Zip Code. RAND State Statistics recently updated its average annual income with detailed information on income tax returns filed in the United States from the year 2011 to the year 2018.
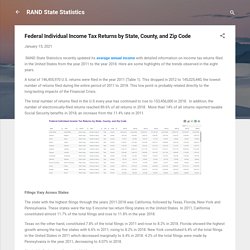
Here are some highlights of the trends observed in the eight years. A total of 146,455,970 U.S. returns were filed in the year 2011 (Table 1). This dropped in 2012 to 145,025,440, the lowest number of returns filed during the entire period of 2011 to 2018. This low point is probably related directly to the long-lasting impacts of the Financial Crisis. The total number of returns filed in the U.S every year has continued to rise to 153,456,000 in 2018. Filings Vary Across States. BANKRUPTCY FILINGS FALL IN SECOND QUARTER OF 2020 HIGHEST IN SOUTH. RAND State Statistics recently updated its business bankruptcy and Bankruptcy database from 1996 to the second quarter (Q2) of 2020.
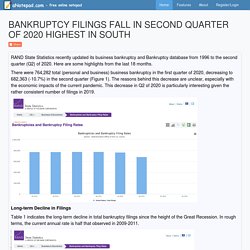
Here are some highlights from the last 18 months. There were 764,282 total (personal and business) business bankruptcy in the first quarter of 2020, decreasing to 682,363 (-10.7%) in the second quarter (Figure 1). The reasons behind this decrease are unclear, especially with the economic impacts of the current pandemic. Death Rates By Cause In US.
Summary: Cause of death by ICD International Classification of Disease (ICD-10) Chapter and Sub-chapter Database Detail Note: Database contains variables for all categories, areas, and time periods for which data are available from the originating source.
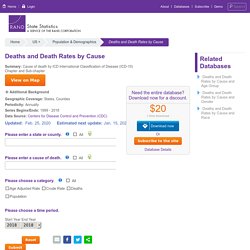
Need the entire database? Download now for a discount. This database reports the number of deaths, crude death rates, and age-adjusted death rates in the U.S., states, and all counties by International Classification of Disease, Version 10 (ICD-10) Chapters and Sub-chapters. For confidentiality reasons, death totals of less than ten are suppressed and are indicated with an asterisk (*). Medical Care Inflation Rates. RAND State Statistics reports a number of inflation databases, including Consumer Prices and Medical Care Inflation.
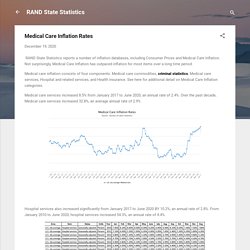
Not surprisingly, Medical Care Inflation has outpaced inflation for most items over a long time period. Medical care inflation consists of four components: Medical care commodities, criminal statistics, Medical care services, Hospital and related services, and Health insurance. See here for additional detail on Medical Care Inflation categories. Medical care services increased 8.5% from January 2017 to June 2020, an annual rate of 2.4%.
Health Insurance in States and Counties. Persons Without Health Insurance Concentrated in South According to recently-released data compiled by RAND State Statistics here arrest statistics, the percentage of persons without health insurance is the highest in several states in the us land area South (Figure 1).
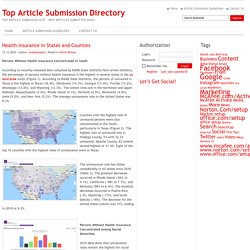
According to RAND State Statistics, the percent of uninsured in Texas is the highest in Texas (18.4%), Oklahoma (14.3%), Georgia (13.4%), Florida (13.2%), Mississippi (13.0%), and Wyoming (12.3%). The lowest rates are in the Northeast and Upper Midwest: Massachusetts (3.0%), Rhode Island (4.1%), Vermont (4.5%), Minnesota (4.9%), Iowa (5.0%), and New York (5.2%). The average uninsurance rate in the United States was 9.2%.
Counties with the highest rate of uninsured persons were also concentrated in the South, particularly in Texas (Figure 2). The uninsurance rate has fallen considerably in all states since 2010 (Table 1). Persons Without Health Insurance Concentrated Among Racial Minorities. Medical Care Inflation Rates. Medical Care Inflation Rates. Bankruptcy Filings Fall In Second Quarter of 2020 Highest in South. Medical Care Inflation Rates. Bankruptcy Filings Fall In Second Quarter of 2020 Highest in South. RAND State Statistics recently updated its Bankruptcy and Bankruptcy database from 1996 to the second quarter (Q2) of 2020.
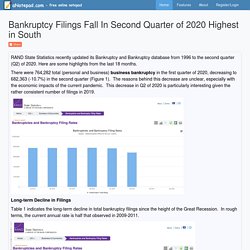
Here are some highlights from the last 18 months. There were 764,282 total (personal and business) business bankruptcy in the first quarter of 2020, decreasing to 682,363 (-10.7%) in the second quarter (Figure 1). The reasons behind this decrease are unclear, especially with the economic impacts of the current pandemic. This decrease in Q2 of 2020 is particularly interesting given the rather consistent number of filings in 2019. Long-term Decline in Filings Table 1 indicates the long-term decline in total bankruptcy filings since the height of the Great Recession.
Bankruptcy Rates Vary Across States. Consumer Price Index For All Urban Consumers. This database provides urban consumer prices for all goods and services, as measured by changes in the Consumer Price Index (CPI-U).

A limited number of measures are available starting in 1913. Most are available for shorter periods. Data are not available for all combinations of items, areas, and time periods. Data are presented as indexes or percentage changes for the preceding 12-month period. For additional details on categories and methodology, see Consumer Price Index. Birth Statistics. This database report counts of live births occurring within the United States by state, county, child's gender and weight, mother's race, mother's age, mother's education, gestation period, and prenatal care.

Births to nonresidents of the United States are excluded from all tabulations by place of residence. Data are derived from birth certificates. Counties with fewer than 100,000 persons are combined together under the label "Unidentified Counties. " Residential Building Permit. US Mortality Rate By Age. Demographics Of US States. Summary: Current resident population Database Detail Note: Database contains variables for all categories, areas, and time periods for which data are available from the originating source.
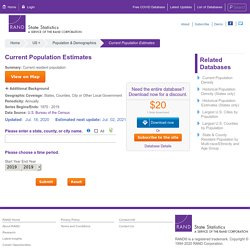
Need the entire database? Download now for a discount. This database estimates total resident population on July 1st of each year for the United States, states, counties, and places (also known as cities or towns). Death statistics By Cause 2020 - by RAND State Statistics [Infographic] Average Inflation Rate. Drug Overdose Deaths. This database report the number of deaths reported as a result of drug overdoses. It includes deaths and death rates from all drugs and from opioids specifically. Opioid deaths include the following based pm Multiple Causes of Death (MCD-10) codes: opium (T40.0), heroin (T40.1), other opioids (T40.2), methadone (T40.3), other synthetic narcotics (T40.4), other and unspecified narcotics (T40.5).
The category "All opioids" reflects the sum of opium, heroin, other opioids, methadone, and other synthetic narcotics. See MCD for additional details on causes of death categories. Note that values of less than ten for any state or county are suppressed to protect privacy. Population figures for years 1999, 2001-2009, and 2011-2017 are bridged-race estimates of the July 1 resident population provided by the National Center on Health Statistics. Crime Statistics. Summary: Number of offenses, arrests, clearances Database Detail Note: Database contains variables for all categories, areas, and time periods for which data are available from the originating source. Need the entire database? RAND State Statistics. Seems suspicious? Report this page to Venngage to help us prevent malicious content. RAND State Statistics.