
Information & Design. Cultural probes (also known as diary studies) provide a way of gathering information about people and their activities.
Unlike direct observation (like usability testing or traditional field studies), the technique allows users to self-report. Information gathered from cultural probes is particularly useful early in the design process. When are Cultural Probes appropriate? CONFERENCE REVIEWS – UXLibs. UXLIBSII: the darkest day – Constructivist. I’m hoping to write three posts about the recent UXLibs conference but time, family and training course preparation may prevent that ambition.
Foster Gibbons cmpd. UX - User Experience - in Libraries. As you can see from all the links above the UX in Libraries Conference was very important in establishing UX in a library context in the UK.
Matt also curated a list of write-ups of the conference. I've copied and pasted the below from his site - it should provide a lot of insight into ethnography, design, and UX in general. The UKAnthroLib blog, mentioned above with the Meg Westbury case study, is a great place to see examples of ethnography in practice. One idea used in ethnography in libraries, but not mentioned above, is the feedback wall – Clare McCluskey has written about the one at York St John here and Andy Priestner has written about one in Cambridge here. Weave: Journal of Library User Experience. The Speaking Wall. At Cambridge Judge we’ve long since abandoned any attempts to elicit views on our information and library services via email.
Nor do we expect to receive many comments or opinions on our social media channels (Facebook Group, Twitter, and Blog) however good they might be. Until recently the most fruitful avenues have been our annual survey, usability interviews, and the termly student feedback committee (which deals with IT and building issues as well as library matters).
However, we have suddenly found ourselves with a new kid on the block which has quickly become the most active platform for our users voices: a graffiti wall. More Than Usable: Library Services for Humans. “UX for the win!” at #CityMash: open and focused coding of qualitative research data for discovery user experience – Ginformation Systems. In Library Services at Imperial College London, between January and April 2015 my team completed two iterations of user experience testing of our Ex Libris Primo discovery system with a view to redeveloping the user interface to provide improved an user experience.
For the #CityMash Mashed Library unconference, Karine Larose and I are running a workshop on the methods we used in our second iteration of testing. Rather than run a ‘show and tell’ about our approach, the workshop will provide experience using our methods with some of our data in a similar way to how we conducted the research ourselves.
We will provide hands-on experience of these methods, attempt to demystify the approaches used, and hope to demonstrate how exciting we find the professional praxis of systems librarianship. This blog post explains the background and provides a practical overview and some theoretical scaffolding ahead of #CityMash. Acknowledgement Why we use constructivist grounded theory #CityMash slides. Toolkit 3.22.11. Graphy » Coding Library Cognitive Maps. After Donna Lanclos’s recent post on using my library cognitive mapping method, a few people asked me to briefly write up my approach to coding the drawings.

The examples I discuss below are drawn from the ERIAL Project, and the exact instructions I gave students were as follows: “You will be given 6 minutes to draw from memory a map of the [NAME] Library. Every two minutes you will be asked to change the color of your pen in the following order: 1. Blue, 2.
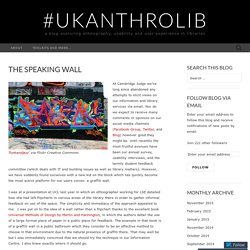
Green, 3. This method assumes that the things people most associate with their “mental map” of the library will appear as elements in the drawing, and that the most important things (or strongest associations) will appear earlier. The mapping activity was conducted away from library building itself both to obtain a diverse cross-section of students (e.g. students who do not regularly use the library) and to obtain a picture of how students conceptualize the library’s spaces that was not influenced by any direct visual references.
ERIAL Project. Playing with Cognitive Mapping. Students these days, part I. This is a post about how, over a very short period of time and with no money, I successfully used a survey and some ethnographic techniques to sharpen the discussion about the users of my library.
Part I of the post covers just the survey and Part II, to be published next week, will cover the ethnographic methods. For better or worse, we carry around a lot of assumptions about our users, many of which are so commonplace, we almost stop thinking about them. One that I hear all the time is that ‘students these days come to university with multiple computing devices’ (i.e. laptops, tablets, mobile phones, etc.). Post-Digital Learning Landscapes. So I've just started to look at what I collected in London last month, but I've actually been thinking about and playing with cognitive maps for the past year or so, and I've got some preliminary analysis already.

Primarily, what I see in the maps that I collect from undergraduates, post-graduates, and faculty/academic staff are learning landscapes. There is much talk of learning "spaces," but I think the problem there with that terminology is that they can be thought of too easily in isolation. "Landscape" implies a network of spaces, with a relationship to each other. Some landscapes are extensive, some are relatively local and limited, but they are all networks, and involve buildings, people, technology, modes of transportation, institutional spaces, commercial spaces, domestic places, and so on. The map above was generated by a 3rd year student in Project Management for Construction.