Marketing Communications Econometrics ‘Principles’ Where to find good data sets. O'Reilly Media has been a big advocate of Open Data and believes that is where a lot of computing is going to be headed in the future.

I think they are definitely on to something. Yet the future could be now. There is a lot of opportunities to find good data sources immediately. One of my favorite blogs, OReilly Radar, has an article by Edd Dumbill on Where To Find Data. There is plenty of good data available on the internet for download to explore and mine new information. Freebase An all-things graph database. Amazon Public Data Sets Amazon is probably considered the cloud computing mecca next to Google. Windows Azure Data Marketplace Surprisingly Microsoft has an open data protocol data source.
Yahoo Query Language YQL is an interesting API that is very similar to SQL. Infochimps Infochimps is a data marketplace warehouse. DBpedia DBpedia is a wikipedia for data sets. Some other sources not from the article include the World Bank open data and the U.S. Estimation of the Weibull Parameters. Statistics Toolbox - Curve Fitting and Distribution Fitting Demo. This example shows the difference between fitting a curve to a set of points, and fitting a probability distribution to a sample of data.
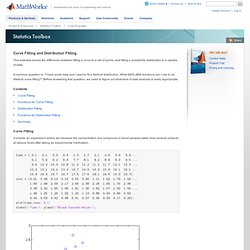
A common question is, "I have some data and I want to fit a Weibull distribution. What MATLAB® functions can I use to do Weibull curve fitting? " Before answering that question, we need to figure out what kind of data analysis is really appropriate. Contents Curve Fitting Consider an experiment where we measure the concentration of a compound in blood samples taken from several subjects at various times after taking an experimental medication. Notice that we have one response variable, blood concentration, and one predictor variable, time after ingestion. Based on theoretical models of absorption into and breakdown in the bloodstream, we might, for example, decide that the concentrations ought to follow a Weibull curve as a function of time. We can fit the Weibull model using nonlinear least squares. modelFun = @(p,x) p(3) .* (x ./ p(1)). Summary.
Rank Regression Parameter Estimation, this issue's Reliability Basic. Rank Regression Parameter Estimation In the last two editions of Reliability Basics, we looked at the probability plotting and maximum likelihood methods of parameter estimation.
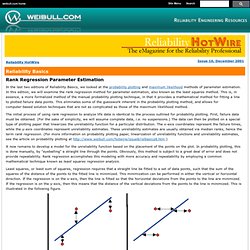
In this edition, we will examine the rank regression method for parameter estimation, also known as the least squares method. This is, in essence, a more formalized method of the manual probability plotting technique, in that it provides a mathematical method for fitting a line to plotted failure data points. This eliminates some of the guesswork inherent in the probability plotting method, and allows for computer-based solution techniques that are not as complicated as those of the maximum likelihood method. Characteristics of the 2-Parameter Weibull Distribution. Calculating the Parameters of the Weibull Distribution. Characteristics of the 1-parameter Exponential Distribution. Polynomial Distributed Lags 1967.pdf (application/pdf Object) Polynomial Distribution Lags and Granger Causality Test. Polynomial Distributed-Lag (PDL) Model Firstly, download the excel file called " sales_inventory" from this page.
Then create a Workfile, import the data from the excel data file and specify the variables as m1, m2, irate, cpi and ip as follow box. Firstly, we postulate the distributed-lag model (Example of Table 17.3 in Gujarati (1995) textbook) as: Yt = α + β0Xt + β1Xt-1 + β2Xt-2 + β3Xt-3 + et Also, assume the βi can be approximated by a second-degree of polynomial in i, the length of the lag, as: βi = a0 + a1i + a2i2 It means β0 = a0 β1 = a0 + a1 + a2 β2 = a0 + a12 + a24 β3 = a0 + a13 + a29 Through substituting into distributed-lag model and transformation, it becomes.
Elasticity (economics) In economics, elasticity is the measurement of how responsive an economic variable is to a change in another.
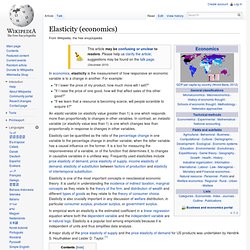
For example: "If I lower the price of my product, how much more will I sell? ""If I raise the price of one good, how will that affect sales of this other good? ""If we learn that a resource is becoming scarce, will people scramble to acquire it? " An elastic variable (or elasticity value greater than 1) is one which responds more than proportionally to changes in other variables. Arc elasticity. Formula[edit] The y arc elasticity of x is defined as: where the percentage change in going from point 1 to point 2 is usually calculated relative to the midpoint: The use of the midpoint arc elasticity formula (with the midpoint rather than the initial point (x1, y1) used for calculating percentages) was advocated by R.
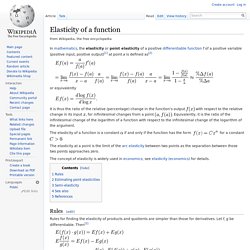
G. D. Elasticity of a function. In mathematics, the elasticity or point elasticity of a positive differentiable function f of a positive variable (positive input, positive output)[1] at point a is defined as[2] or equivalently It is thus the ratio of the relative (percentage) change in the function's output with respect to the relative change in its input , for infinitesimal changes from a point .