
Hell and High Water: Why Isn’t Texas Ready for the Next Big Hurricane? Return to Map It is not if, but when Houston’s perfect storm will hit… They called Ike “the monster hurricane.”
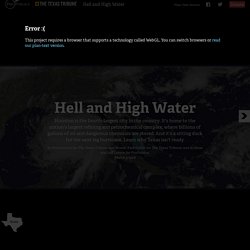
Hundreds of miles wide. Winds at more than 100 mph. And — deadliest of all — the power to push a massive wall of water into the upper Texas coast, killing thousands and shutting down a major international port and industrial hub. That was what scientists, public officials, economists and weather forecasters thought they were dealing with on Sept. 11, 2008, as Hurricane Ike barreled toward Houston, the fourth-largest city in the United States and home to its largest refining and petrochemical complex. “ALL NEIGHBORHOODS, AND POSSIBLY ENTIRE COASTAL COMMUNITIES, WILL BE INUNDATED,” the alert read. But in the wee hours of Sept. 13, just 50 miles offshore, Ike shifted course. Still, scientists say, Houston’s perfect storm is coming — and it’s not a matter of if but when. Such a storm would devastate the Houston Ship Channel, shuttering one of the world’s busiest shipping lanes.
Boomtown, Flood Town. Climate change will bring more frequent and fierce rainstorms to cities like Houston.
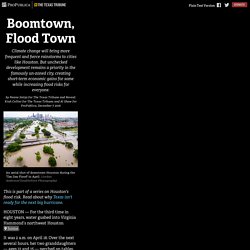
But unchecked development remains a priority in the famously un-zoned city, creating short-term economic gains for some while increasing flood risks for everyone. by Neena Satija for The Texas Tribune and Reveal; Kiah Collier for The Texas Tribune; and Al Shaw for ProPublica, December 7, 2016. Live Hacking and Ransomware Tracking Maps Online. CGRU.
OpenData URB. Goo Systems, Screen Goo, Projector Screen Paint, Digital Signage. A global map of wind, weather, and ocean conditions. Date | 2016-12-12 16:00 Local ⇄ UTC Data | Wind @ Surface.
Google Arts & Culture Experiments - t-SNE Map Experiment. U.S. Presidential Election 2016 (Cartogram) ON1 Photo 10.5 Feature List – ON1, Inc. Download. To download and run LuxRender, please follow the following steps:
Internet Research Software. TumblrTool. Courtesy of Messe Basel This constant architectural variation is reinforced, paradoxically, by applying a homogeneous material (aluminum) over all exterior surfaces.
The facade of articulated twisting bands strategically modulates and reduces the scale of the large exhibition volumes to its surroundings. This is not simply a decorative element but a practical means to regulate the fall of natural light on adjacent properties and to frame specific views from individual spaces, primarily the social areas above the City Lounge, towards the public life of the city. Multi-view workflow in Natron. FindA.Photo: 10,000 completely free stock photos to use for any purpose.
Stock photo search made easy Browse through over 1 million high-quality stock photos across multiple free and paid stock photo sites - from one tab. Where to hate daylight saving time and where to love it. By Andy Woodruff on 16 November 2015 tl;dr version: just scroll down and play with the map.
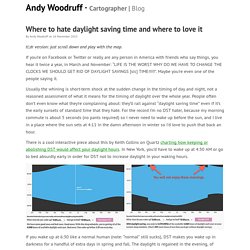
If you’re on Facebook or Twitter or really are any person in America with friends who say things, you hear it twice a year, in March and November: “LIFE IS THE WORST WHY DO WE HAVE TO CHANGE THE CLOCKS WE SHOULD GET RID OF DAYLIGHT SAVINGS [sic] TIME!!!!!”. Maybe you’re even one of the people saying it. Usually the whining is short-term shock at the sudden change in the timing of day and night, not a reasoned assessment of what it means for the timing of daylight over the whole year. Programmation sous R. Statistics with R. Warning Here are the notes I took while discovering and using the statistical environment R.
However, I do not claim any competence in the domains I tackle: I hope you will find those notes useful, but keep you eyes open -- errors and bad advice are still lurking in those pages... Should you want it, I have prepared a quick-and-dirty PDF version of this document. The old, French version is still available, in HTML or as a single file. You may also want all the code in this document. 1. The Bézier Game. Video Mapping Software by LeCollagiste. Spout. Software for artists and vj's. Fugio (pronounced foo-gee-oh) is a software platform for building digital art quickly, with no programming experience required.
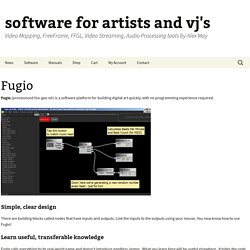
Simple, clear design There are building blocks called nodes that have inputs and outputs. Link the inputs to the outputs using your mouse. You now know how to use Fugio! Learn useful, transferable knowledge. Jahshaka, ReInventing Hollywood. KC Softwares. The depth camera visualization tool. Vezér - Mac MIDI/OSC/DMX timeline sequencer and control software made for audiovisual artists. Logiciel libre de video mapping. LPMT – Little Projection-Mapping Tool. Fitness & Outdoors.
Non-commercial NUKE. Exemples d’utilisation. Le projet QGIS est toujours à la recherche de récits (d’utilisateurs) afin de partager des cas d’études sur son site web.
Nous sollicitons le témoignage d’institutions, universités, collectivités territoriales et entreprises relatant leur expérience de QGIS pour solutionner leurs problèmes au quotidien. Veuillez contacter la communauté QGIS, si vous souhaitez nous faire part de votre expérience. Unity Manual. Unity is made to empower you to create the best interactive entertainment or multimedia experience that you can.

This manual is designed to help you learn how to use Unity, from basic to advanced techniques. It can be read from start to finish or used as a reference. If you find that any question you have is not answered in this manual please ask on Unity Answers or Unity Forums. You will be able to find your answer there. For information about upgrading projects from Unity 4 to Unity 5, see our Upgrade Guide here. Ngram Viewer. Convertir des coordonnées. Datawrapper.
Hub - Find, grab and organize all kinds of data and media from online sources. OutWit Hub Light is free and fully operational, but doesn’t include the automation features and limits the extraction to one or few hundred rows, depending on the extractor. When purchasing the Pro version, you will receive a key to remove these limitations and unlock all advanced features. Buy Now. sStory. sStory is designed to make it easy to tell beautiful stories on the web with a variety of media. It will take care of the presentation and technical aspects of telling a story through the web so that creators can focus on the narrative and gathering great material. sStory is an open-source self-hosted solution so that creators, journalists, and newsrooms can publish their work online without trusting someone else’s server or terms of service.
It is also meant to be customized and extended, Pull Requests and ideas welcome! Easily stitch together sections made of photos, videos, sounds, maps and moreFocused on beautiful presentation and interactionsExtendable, made to fit into pre-existing systems and CMSSupports YouTube, Vimeo, SoundCloud, and more for embedding mediaYour story’s structure is stored in hand-editable JSON Getting Started. sStory. Histoire du journalisme de demain. Liste des outils et bonnes pratiques repérés par la communauté Google+ Tendances des recherches. Open Broadcaster Software - Index. Graph Computation, Layout, Algorithms for JavaScript. School of Data - Evidence is Power. Datawrapper. GeoGuessr - Let's explore the world!
Product Features. A tour of PaperCut's print management & control features. Img.bi. Visualisation Ontology (VISO) Introduction The Visualisation Ontology (VISO) defines concepts and relations from the field of graphics and visualisation. The ontology is split into seven main modules, each being concerned with a specific field of visualisation. These modules include the graphic module, the data module and the facts module and other modules such as activities and system context modules*. At the bottom of each resource you will find a link to the discuss it in the VISO Question and Answers forum. Please also note our Blog on VISO. Palmiers Clip Art Libres De Droits , Vecteurs Et Illustration. Image 6865927. KARL - Frequently Asked Questions. What is a Knowledge Management System (KMS)? The general term “Knowledge Management System” (KMS) refers to a system for supporting the creation, capture, storage and dissemination of information in organizations.
A KMS enables collaboration, co-creation of content, and efficient use of information resources by systemizing activities ranging from project management to inter-office communication. A KMS also serves as a knowledge repository for the organization that is searchable and easy to access. AR Standards. Using The Package Manager Console. This topic describes how to find, install, remove, and update NuGet packages using PowerShell commands. VISLE CONCOURS PHOTO 2013. Tutorials / projects. Community. PLOTS Map Knitter. Architecture. OpenEarth tutorials - OpenEarth - Deltares Public Wiki. Puppet Labs: IT Automation Software for System Administrators.
Home. Grand Lyon Smart Data. Well-formed data. Stratégies digitales et exploration d'Internet. Vous connaissez mon amour pour la data visu (aussi appelée Infographics). Mais c’est souvent difficile à réaliser car il faut à la fois les compétences d’un ergonome et d’un créatif. Mais heureusement, vous allez pouvoir créer votre data visu en quelques secondes en répondant juste à des questions.
En effet, l’agence Brésilienne Ionz, explorateur du digital (<autopub>un peu comme Curiouser quoi </autopub>), nous propose de créer une Datavisu de sa propre vie digitale et de l’exporter sur un superbe Wallpaper. Je trouve le résultat superbe et même si j’aurais aimé complexifier la chose, il s’agit d’une excellente idée de promotion d’une agence digitale (35 900 visiteurs déjà). L’image intégrale après le jump : Il est également intéressant de regarder les tendances des personnes interviewées (je suis un peu perdu avec mon vieil ICQ). Qu’en pensez-vous ? Sur ce site: Rapid - I. 5 Creative Google Image Search Visualizations. 5 Unusual Uses of Google Image Search You Might Not Have Heard About.
Free Sound Effects - SoundGator. Program / Libre graphics meeting, April 10-13 2013, Madrid. La Société des arts technologiques [SAT] Society for Arts and Technology. « Motorville » : A bout de soif. «Motorville», indique la pancarte. Un pont au-dessus du périphérique, des voitures roulent à toute vitesse, du bruit, des klaxons et des buildings. Bienvenue dans une ville des États-Unis. OpenData - Home. Many Eyes. Learn how to use Gephi.
Welcome to Gephi! Actualité des données.
Choosing the Right Chart Page Revised.indd. JOSM. La boite à outils. Understanding multi-dimensional arrays. Liste des liens - Cours du 01 mars 2013. Online Diagram Software and Flowchart Software - Gliffy. Mbostock/d3. Untitled. DAM. Créer des infographies. MindMap.