
SexiLog. By default, SexiLog is published with 2 hard disks.
The first one is dedicated to the system and host / mount point. The second one (50GB) is dedicated to /sexilog and is used to host all elasticsearch, logstash and kibana data. If you want to extend the second disk, you should follow these steps: Extend the hard disk of the appliance (through vSphere Client, PowerCLI or any other mean )Update your OS informations (with fdisk command line)Update your mount point (with resize2fs tool) Curator is used to purge elasticsearch shards in order to limit data growth. This is done via updating crontab configuration file located at /etc/crontab # cat /etc/crontab 5 * * * * root curator delete --disk-space 10 You just have to update the parameter --disk-space 10 to specify the limit (in GB) elasticsearch shards should be limited to. As described in the Features tab, snmptrapd forwards traps to logstash through rsyslog. SexiMenu have been built to make appliance’s common configuration steps easier. ).
WinEventType. Winlogbeat Configuration. The winlogbeat section of the winlogbeat.yml config file specifies all options that are specific to Winlogbeat.
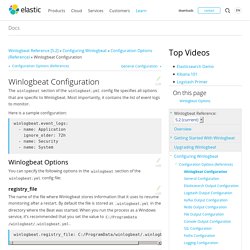
Most importantly, it contains the list of event logs to monitor. You can specify the following options in the winlogbeat section of the winlogbeat.yml config file: The name of the file where Winlogbeat stores information that it uses to resume monitoring after a restart. By default the file is stored as .winlogbeat.yml in the directory where the Beat was started. When you run the process as a Windows service, it’s recommended that you set the value to C:/ProgramData/winlogbeat/.winlogbeat.yml. winlogbeat.registry_file: C:/ProgramData/winlogbeat/.winlogbeat.yml The forward slashes (/) in the path are automatically changed to backslashes (\) for Windows compatibility.
A list of entries (called dictionaries in YAML) that specify which event logs to monitor. Winlogbeat.event_logs: - name: Application event_logs.batch_read_sizeedit The name of the event log to monitor. Sending Windows Event Logs to Logstash - /dev/random. Windows Powershell ELK Log Wash! - HAZZY. The TLDRGrumpy Admin, plays around in PowerShell trying to send Historic Windows Events to his ELK stack and when he gets frustrated that it’s not exactly working, he googles and lifts someone else’s code off GitHub to make it work – ergo happy Grumpy Admin!
Main Post Grumpy Admin here, I was asked to implement a logging system – so I decided to implement an ELK stack. I know of it, and played around but this implementation was going to be running in parallel to our production logging solution with the hopes that once configured correctly and proved to be stable. ELK can take its place and the primary logging solution for the company.
Naturally, prior to implementation, I produced a working ELK stack that worked like a charm for our Cisco ASA firewall logs. Finally I’m allowed to build what will be my production ELK stack, as it turns out it will be another “proof in concept” rig, and another rebuild will be required! So I thought, I would try! Kibana User Guide [5.0] Beats Platform Reference [5.0] Step 2: Configuring Winlogbeat. Monitoring avec ELK – Windows et NXlog! On a vu comment dans un précédent article comment mettre en place la pile ELK pour recevoir nos logs.
Maintenant, on va tenter de voir comment y balancer les événements produits par des machines sous windows. Je me suis inspiré des articles suivants : Au boulot! On commence par ajouter un nouvel input à logstash toutes les confs de logstash se gèrent dans /etc/logstash/conf.d/ : input { tcp { port => 3515 type => "nxlog" codec => line { charset => "CP1252" } }} On créé maintenant un nouveau filtre pour mettre en forme les logs : filter { if [type] == "nxlog" { json { source => "message" } mutate { rename => [ "Message", "message" ] } }} Monitoring - How to send Windows Performance counters to Logstash + Kibana? Part 1.[Overview] ElasticSearch, Kibana, Logstash, and Windows Metrics over PowerShell TCP Connections. Part 1.
![Part 1.[Overview] ElasticSearch, Kibana, Logstash, and Windows Metrics over PowerShell TCP Connections](http://cdn.pearltrees.com/s/pic/th/elasticsearch-connections-142278297)
[Overview] ElasticSearch, Kibana, Logstash, and Windows Metrics over PowerShell TCP ConnectionsPart 2. [PSJSON] The Powershell JSON TCP ConnectionPart 3. [PSGet-Counter] The Powershell Get-Counter cmdlet You want to monitor performance metrics on your Windows machines. You want to play in the open source world, and have found that there are no good documented ways to gather perf metrics on Windows and ship them over to logstash. Here iss the high-level overview: Windows machine->Powershell Scheduled Task->Output of Get-Counter->TCP Socket opened to Logstash server->JSON data sent to Logstash->Logstash conf receives->Sends to Elasticsearch->Displayed in Kibana. Here is the github repo Here are some assumptions: 1) You have a working ELK server. What you get is output something like this: OutsideIT - Monitoring and Automation to Invent Your Own Future. OutsideIT - Monitoring and Automation to Invent Your Own Future.
Monitoring Windows Scheduled Tasks - OutsideIT. Step 2: Configuring Winlogbeat.