
La boite à outils. Q3 2010 brings more slickness, performance and new controls to RadControls for Silverlight/WPF. Silverlight Data Visualization Controls - High Performance Silverlight Charting and Analysis. Get your 30 Day Free trial of Silverlight Controls as part of Infragistics Ultimate.
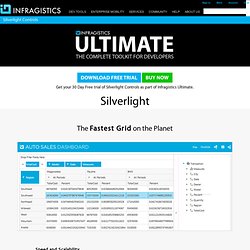
The Fastest Grid on the Planet Speed and Scalability When it comes to your Silverlight applications, performance matters. If you have massive amounts of data that requires lightning-fast processing, only the industry’s top-performing controls will do. No other Data Grid on the market can even compare to the power and performance level you get with the Infragistics Silverlight Data Grid. Silverlight Treemap Control. Microsoft’s Global Product Development – Europe team recently released a Silverlight version of the Treemap visualization for adCenter Analytics.
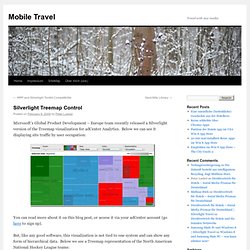
Below we can see it displaying site traffic by user occupation: You can read more about it on this blog post, or access it via your adCenter account (go here to sign up). But, like any good software, this visualization is not tied to one system and can show any form of hierarchical data. Below we see a Treemap representation of the North American National Hockey League teams: The component consists of two main parts: the Treemap component itself, which visualises the data and the shell, which configures the control, displays information about the cells and even has a ledger at the bottom for keeping note of the information related to the selected cells. TreeMap. Plateforme de développement. Introducing Worldview. The KPI Dashboard - Evolved. Solution Décisionnelle.