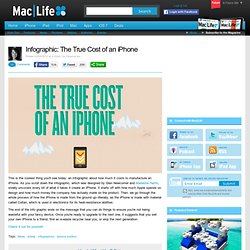

Infographic: The True Cost of an iPhone. Posted 04/05/2012 at 3:22pm | by Florence Ion This is the coolest thing you'll see today: an infographic about how much it costs to manufacture an iPhone.

As you scroll down the infographic, which was designed by Glen Newcomer and Madeline Harris, slowly uncovers every bit of what it takes it create an iPhone. It starts off with how much Apple spends on design and how much money the company has actually made on the product. Then, we go through the whole process of how the iPhone is made from the ground up--literally, as the iPhone is made with material called Coltan, which is used in electronics for its heat-resistance abilities. The end of the info graphic ends on the message that you can do things to ensure you're not being wasteful with your fancy device. Check it out for yourself.
Pinterest / Home. Discover Yourself! An illustrated guide to NHL players that logged 1,000 or more games with one team. INFOGRAPHIC: This Is How Your Memory Works. Infographic: The Growth of Enterprise Mobility. No industry vertical has been more disrupted by the evolution of the smartphone than the enterprise.

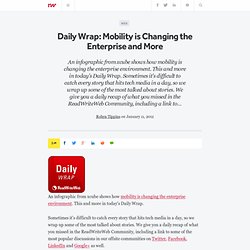
Since Apple released the iPhone in 2007 and the subsequent rise of Android, IT departments have struggled to reconcile device and application management, security and software deployment. What to do when every employee wants to bring their own device to work? An infographic from xcube puts the changing enterprise mobile landscape into perspective. For instance, 63% of enterprises look to mobility for cost savings and near 50% are responding to employee demand. Since the end of the third quarter in 2011, the iPhone is the most preferred smartphone in the enterprise at 45%. Brands are flocking to apps. Business apps were the fastest growing section in the Apple App Store from 2009 to 2010, up 186%. The information in the infographic was culled from research reports from research firms and analysts such as Ovum, Yankee Group, Distimo, Forrester and comScore. Daily Wrap: Mobility is Changing the Enterprise and More. An infographic from xcube shows how mobility is changing the enterprise environment.

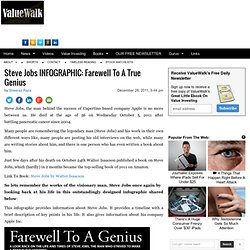
This and more in today's Daily Wrap. Sometimes it's difficult to catch every story that hits tech media in a day, so we wrap up some of the most talked about stories. We give you a daily recap of what you missed in the ReadWriteWeb Community, including a link to some of the most popular discussions in our offsite communities on Twitter, Facebook, LinkedIn and Google+ as well. Infographic: The Growth of Enterprise Mobility Enterprise has been disrupted in a significant way by the smartphone. The American Debt Crisis [INFOGRAPHIC] Steve Jobs INFOGRAPHIC: Farewell To A True Genius. Steve Jobs, the man behind the success of Cupertino based company Apple is no more between us.

He died at the age of 56 on Wednesday October 5, 2011 after battling pancreatic cancer since 2004. Many people are remembering the legendary man (Steve Jobs) and his work in their own different ways like, many people are posting his old interviews on the web, while many are writing stories about him, and there is one person who has even written a book about him.
Just few days after his death on October 24th Walter Isaacson published a book on Steve Jobs, which (hardly) in 2 months became the top-selling book of 2011 on Amazon. Link To Book: Steve Jobs by Walter Isaacson So lets remember the works of the visionary man, Steve Jobs once again by looking back at his life in this outstandingly designed infographic shared below: This infographic provides information about Steve Jobs. Via. How To Make Money On The Internet [INFOGRAPHIC] This infographic blends humor and logic to provide information on the best way to make money on the internet.
![How To Make Money On The Internet [INFOGRAPHIC]](http://cdn.pearltrees.com/s/pic/th/internet-infographic-valuewalk-20099421)
It provides a diagram to show the different internet money making ventures and specific examples in each category. via. 93% Of Facebook Users Share Shopping Suggestions This Season: Infographic. (via Infographic Of The Day: The Blessing And...